Ian Ashdown, P. Eng, FIES, Senior Scientist, SunTracker Technologies Ltd.
Published: 19/11/14.
Whether you call it “circadian lighting,” “biologically effective lighting” or some other name, the principle is the same: the color and intensity of light can be used to regulate the timing of our biological clocks, or “circadian rhythms.” For architects and lighting designers, this is an opportunity to provide healthy and comfortable environments for building occupants.
From an academic perspective, circadian lighting represents the culmination of over two decades of research into the effects of light on circadian rhythms. While there remain a number of open questions and ongoing research to address them, it has been argued that we now know enough to translate this knowledge into practice with building code standards and recommended practices for architectural lighting design. From an engineering perspective … not so fast. A look at three metrics shows why.
WELL Building Standard
The WELL Building Standard v2 with Q1 Addenda is dedicated to the concept of building designs that promote healthy environments for living, working, learning and play. One of its hundreds of design guidelines is Feature 54, Circadian Lighting Design (https://standard. wellcertified.com/light/circadian-lighting-design).
The underlying concept is simple: predict or measure the Equivalent Melanopic Lux (EML) incident on the vertical plane at the eye level of the occupant. For work areas, the design requirements are then:
- At 75% or more of workstations, provide at least 200 EML (including daylight if present) at four ft above the floor facing forward (to simulate the view of the occupant) between the hours of 9:00 am and 1:00 pm for every day of the year; or
- For all workstations, provide maintained illuminance of at least 150 EML on the vertical plane facing forward.
There are similar requirements for living environments, breakrooms and learning areas. Unfortunately, architectural lighting design programs such as Lighting Analysts’ AGi32 and DIAL’s DIAL Evo do not predict EML. They do, however, predict photopic vertical illuminance, EV. All the designer has to do then is to calculate or measure EV values and multiply them by the melanopic ratio, R.
How do you calculate this ratio? These are the instructions from Table L2 of Feature 54: “To calculate the melanopic ratio of light, start by obtaining the light output of the lamp at each 5 nm increment, either from [the] manufacturer or by using a spectroradiometer. Then, multiply the output by the melanopic and visual curves given below to get the melanopic and visual responses. Finally, divide the total melanopic response by the total visual response and multiply the quotient by 1.218.”
The International WELL Building Institute helpfully provides a downloadable Excel spreadsheet to perform these calculations, which includes six sample spectra for common light sources—easy. Once again, from an engineering perspective, however … not so fast.
Questions, Questions …
Questions regarding the WELL Building Standard, or at least Feature 54, arise when considering how architectural lighting design is performed in practice. For example:
- Unlike measurements of horizontal illuminance (EH), vertical illuminance (EV) measurements require both a specified position and a direction for the meter sensor. Four ft above the floor to “simulate the view of the occupant” makes sense, but it overlooks the reality that information on workstation locations and their associated furniture is often unavailable during the design phase.
- Obtaining the spectral power distributions (SPDs) of luminaires from the manufacturer is in most cases all but impossible. This may change in the future as lighting design and analysis software programs become capable of utilizing this information directly, but for now it is mostly necessary to either manually digitize the manufacturers’ printed datasheets (if available) or measure representative products with a spectroradiometer. This is rarely practical during the design phase, when it is unlikely that specific products will have been identified.
- Handheld spectroradiometers for field measurements are readily available, but they typically have a spectral resolution of 8 to 10 nm. They may report spectral power distributions in 5-nm or even 1-nm increments, but these are interpreted values. Depending on the light source (including particular fluorescent lamps and LED modules with “spiky” distributions), the calculation of equivalent melanopic lux from EV measurements may be insufficiently accurate. Following CIE recommendations for spectral metric calculations, a spectral resolution of at least 5 nm is required.
- For workstations, what about the computer display monitors that the occupants will presumably be facing for most of the workday? With luminance values in the range of 250 to 350 candelas per sq meter, display monitors provide considerably more vertical illumination than the surrounding cubicle walls do, and they further have SPDs similar to white light LEDs of 6500K. If anything, they likely contribute more to the circadian lighting as perceived by the workstation occupants than the room lighting does. If they are to be considered, how should they be modeled? More important, what is their angular subtense in the occupant’s field of view? A dual 27-in. display fills much more of the occupant’s field of view than does a 17-in. display, for example.
- Should daylight be included in the predictions or measurements of vertical illuminance? The amount of daylight entering an interior work space depends on the time and date, the building orientation and windows configuration, the sky condition (clear to overcast), the glazing transmittance, whether the blinds are open or closed, and the office partitions and furniture layout. Moreover, what is the SPD of the daylight on clear and overcast days? (The CCT of daylight can vary from 5500K for direct sunlight to more than 25000K for clear blue poleward sky.) Also, in modeling daylight, this should include the daylight diffusely reflected from the exterior ground, as it typically comprises some 10-20% of the daylight entering the space on overcast days.
- How should multiple light sources, each with their own SPDs, be modeled? The occupant’s position and orientation at a “typical” workstation might include, depending on the time of day, direct sunlight, diffuse daylight, direct illumination from overhead luminaires, and indirect light from possibly strongly colored surfaces that are illuminated by both overhead luminaires and a desk lamp. It is all but impossible to predict the contributions of these light sources to the vertical illuminance, let alone calculate the resultant composite SPD as seen by the observer.
To put these questions into context, imagine the WELL design requirements being incorporated into Section 16500 clauses of a building specification contract document. It is one thing for an engineer or lighting designer to follow the WELL requirements as guidelines and feel comfortable in saying that the design is compliant; it is quite another when a contractual dispute arises or a building inspector decides to take in situ measurements. From a legal perspective, such ambiguities in the specifications are definitely not a good thing.
Circadian Stimulus
UL is currently preparing UL 24480, Recommended Practice and Design for Promoting Circadian Entrainment with Light for Day-Active People, a document that is based on the Circadian Stimulus (CS) metric developed by Rensselaer Polytechnic Institute’s Lighting Research Center. One of the key features of this document is that it relies on the user accessing the LRC’s CS Calculator (lrc.rpi.edu/cscalculator/), a web-based tool for converting predicted or measured vertical illuminance values into CS metric values.
Unlike the WELL spreadsheet, the CS Calculator offers close to 200 different lamp SPDs for the designer to choose from. If, for example, you are interested in 3500K LED light sources, there are 19 SPDs to choose from, while for 4000K LEDs there are 20, and eight for 5000K … and therein lies a problem. For the designer, how do you choose?
Like the WELL’s EML metric, the CS metric is calculated from predicted or measured vertical illuminances, with minimum recommended CS values for different situations. If, for example, the design requires a CS value of 0.30, the designer chooses a light source from the list of options (or provides a custom SPD with 5-nm resolution); the calculator then determines the vertical illuminance needed to achieve this value.
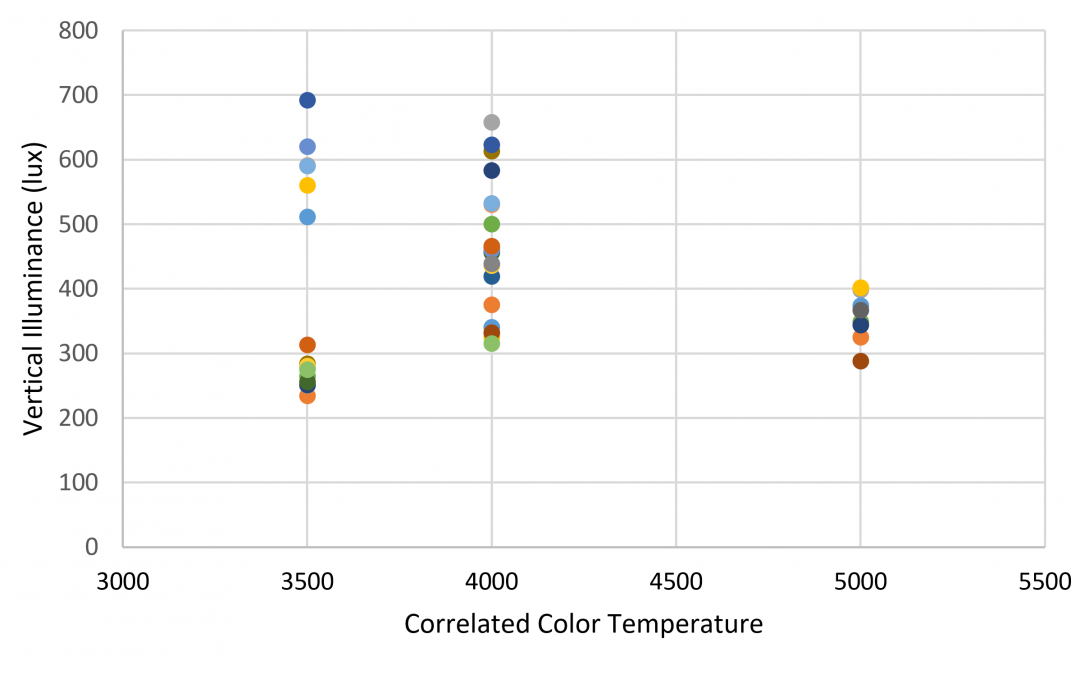
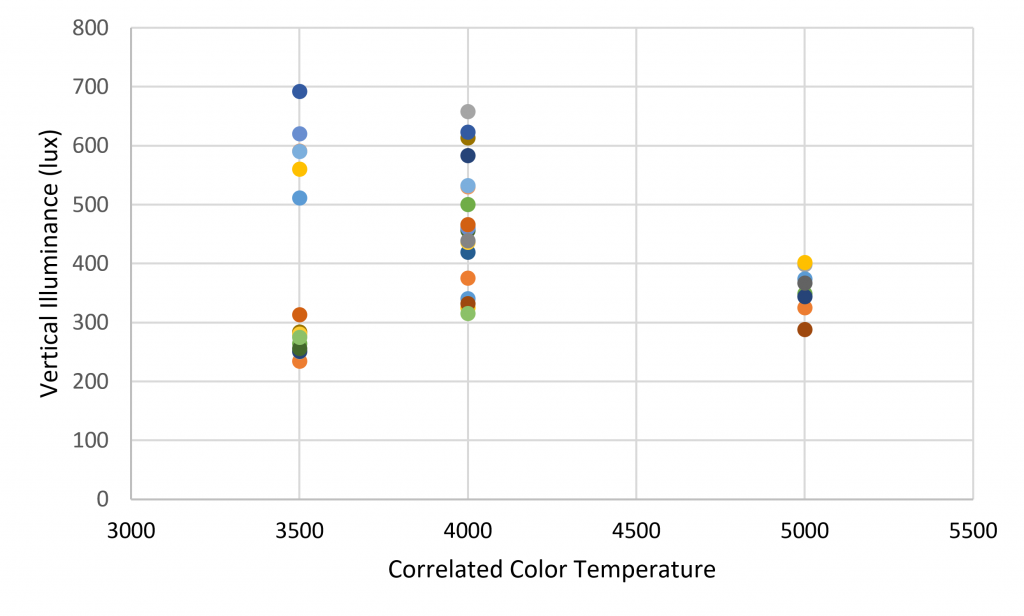
The problem is that even with the same correlated color temperature, the range of required vertical illuminances for the different LEDs is shocking (Figure 1). To be fair, some of these LED light sources are unconventional, including violet-pump LEDs (approximately 415 nm) with triphosphor coatings, and hybrid white-light LEDs combined with deep-red LEDs to boost the CRI R9 values. However, there is nothing to stop the designer from randomly choosing one of these products as a “typical” LED light source for calculation purposes.
If nothing else, Figure 1 makes one point perfectly clear: there is no reasonable relationship between CCT and the CS metric, at least for 3500K and 4000K LEDs. The range of vertical illuminances for 3500K LEDs is 3:1, while that for 4000K LEDs is 2:1. Randomly choosing an LED product as representative of all LEDs with the same or similar CCT could lead to problematic consequences.
Compared to the 3500K and 4000K LEDs, the range of vertical illuminances for 5000K LEDs is quite small—only +/- 9%. The reason for this is that the eight LEDs appear to have almost identical SPDs above 500 nm, which is entirely due to the yellow-emitting phosphor blend. The only significant differences are the peak wavelengths of the blue-pump LEDs, which vary from 440 to 450 nm. This situation could, however, change with future developments in LED and phosphor technologies.
Additionally, what if the building specification permits “or equal” substitutions for luminaires? The CS metric value depends on the absolute spectral irradiance incident on the observer’s corneae, and so the luminaire product specification sheet would have to provide a graph of EV versus CS. Further, depending on the EV tolerance the designer is willing to accept, many more products may be disqualified compared to evaluation on luminous flux alone. As any experienced commercial electrical engineer will attest, this can lead to rather heated discussions between the engineering and architectural firms or with the electrical contractor.
Furthermore, the CS Calculator allows the designer to specify multiple light sources and combines their SPDs into a composite SPD as seen by the occupant. However, it is left as an exercise for the designer to calculate the relative contribution of each light source—including indirect light from possibly colored surfaces in the office space or wherever (and not to mention daylight with its range of possible CCTs)—to any predicted vertical illuminance. It is possible to do this with existing architectural lighting design programs, but only if the designer is willing to model and calculate the spatial light distribution in the environment separately for each type of light source. In addition, these programs do not take light source SPDs into account apart from their CCTs, so the results would be at best approximate.
EML versus CS
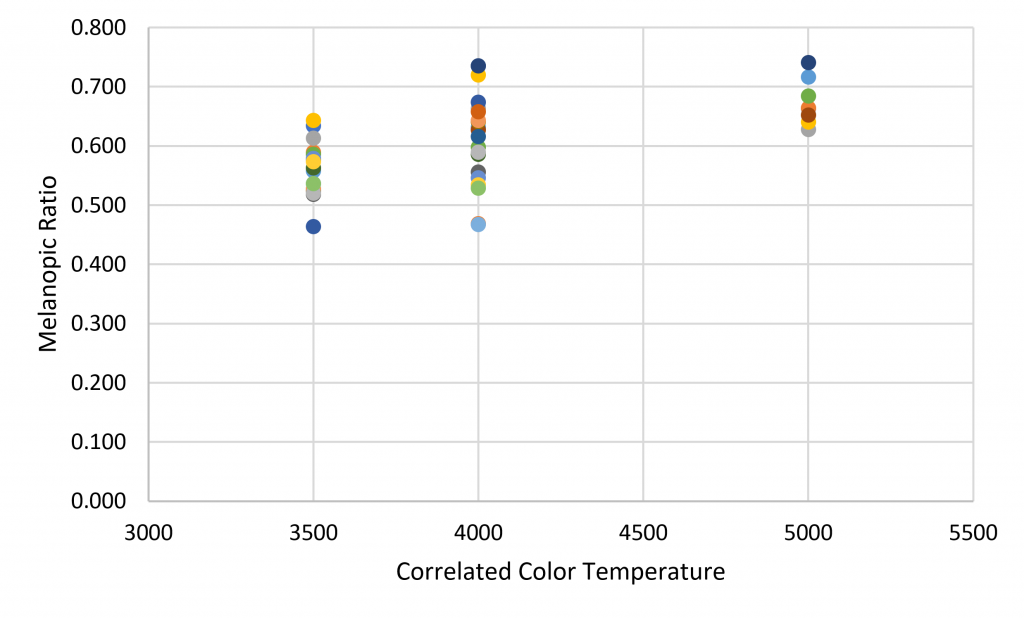
This is for the CS metric — what about the EML metric? Fortunately, the CS Calculator provides relative SPDs for each of its light sources, with resolution of 2 nm. Rescaling these SPDs to 5-nm resolution and using the WELL spreadsheet produces the melanopic ratios (R) shown in Figure 2.
There is still a 60% variation in the EML values for a given vertical illuminance value for LEDs of 4000K. This may be preferable (from an engineering perspective) to the 3:1 variation for the CS metric, but it is still an unreasonably wide range for lighting design purposes. It also begs the question: what are the criteria for choosing either the WELL or CS metrics apart from tolerances? Which circadian lighting metric better represents the effect of the lighting on circadian rhythm entrainment? Simply choosing the metric that offers the best results borders on unethical engineering practices.
In summary, we may now “know enough” about the effects of light on our circadian rhythms to design circadian lighting. Whether this is true is debatable, but it is also beside the point. From an engineering perspective, it is abundantly clear that we do not have the calculation tools needed to predict or measure circadian lighting metrics, including EML and CS, to acceptable engineering standards.
For reference, it is generally accepted that architectural lighting design software is capable of predicting horizontal and vertical illuminance values to within +/-10%, given reasonably accurate surface colors and reflectance values. With circadian lighting metrics, however, we are confounded by the variations between different LED products with the same CCT.
We are further confounded by what exactly it is we are expected to predict with our lighting design software or measure in the field. Simply saying “workstations” and “vertical illuminance” belies the complexity of both our architectural environments and our behaviors in them. This is not something that any standard or recommended practice can ever hope to reasonably address—there are simply too many variables for the designer to consider.
Regardless of what we may know about the effects of circadian lighting on human health and wellbeing, we may never be able to codify this knowledge in building design practices. It is reasonable for standards organizations to offer design guidelines based on what we know, and it is highly recommended that lighting designers learn the principles and benefits of circadian lighting. These should not, however, be codified as inflexible design requirements.