Ian Ashdown, P. Eng., FIES, Senior Scientist, SunTracker Technologies Ltd.
Published: 2015/11/24
A previous blog article — The Kruithof Curve — examined the history of the Kruithof curve (Kruithof 1941]) shown in FIG. 1:

To summarize the article, “The Kruithof curve itself was thoroughly debunked a quarter-century ago with three exhaustive studies involving up to 400 participants (as opposed to two people in Kruithof’s study, including himself).” These studies were Bodman (1967), Boyce and Cuttle (1990), and Davis et al. (1990).
In other words, the weight of scientific evidence is firmly against use of the Kruithof curve as a guide to modern lighting design practices. Case closed, yes?
No.
The problem with the above studies — and indeed any studies to date that have addressed our preferences regarding correlated color temperature (CCT) versus illuminance — is that they were based on constant CCT light sources.
This is completely understandable in that while we have had dynamic color-changing luminaires for over a decade (e.g., Ashdown 2006), color-changing luminaires for general illumination purposes have only become available in the past year or so. However, it begs the question: is there a relationship between CCT preferences and circadian rhythms?
Circadian Rhythms
Another blog article — Entraining Circadian Rhythms: Intensity verus Color — examined the question of whether the change in yellow-blue color ratio during twilight is more efficient in entraining circadian rhythms than changes in daylight intensity.
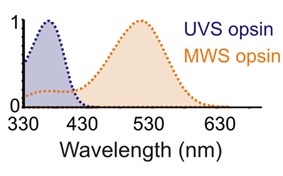
As noted in this article, the research (Walmsley et al. 2015) considered the behavior of wild mice rather than humans. The problem, of course, is that humans and mice see the world very differently in terms of perceived color. Whereas our retinal cones are responsive to the visible spectrum ranging from approximately 400 nm (violet) to 700 nm (deep red), those of wild mice are responsive to a spectrum ranging from below 330 nm (ultraviolet UVB) to 625 nm (medium red). Being dichromatic, mice are also likely to have poor color-distinguishing capabilities compared to humans.
Regardless, Walmsley et al. make a compelling argument that the ratio of yellow-to-blue light remains reasonably constant throughout the day, whereas the intensity of daylight may vary randomly and markedly due to cloud cover. From an evolutionary perspective, it therefore makes sense that human circadian rhythms are primarily entrained by changes in daylight color at dawn and dusk rather than changes in illuminance.
We must also remember, however, that illuminance and color are not the only factors influencing our circadian rhythms. Yetish et al. (2015) studied the sleep patterns of three pre-industrial societies: the Hadza in Tanzania, the Kalahari San in Namibia, and the Tsimane in Bolivia. What they found was that all three groups exhibited similar sleep patterns. With no cross-cultural influences, it is reasonable to assume that these represent core human sleep patterns for pre-industrial Homo sapiens.
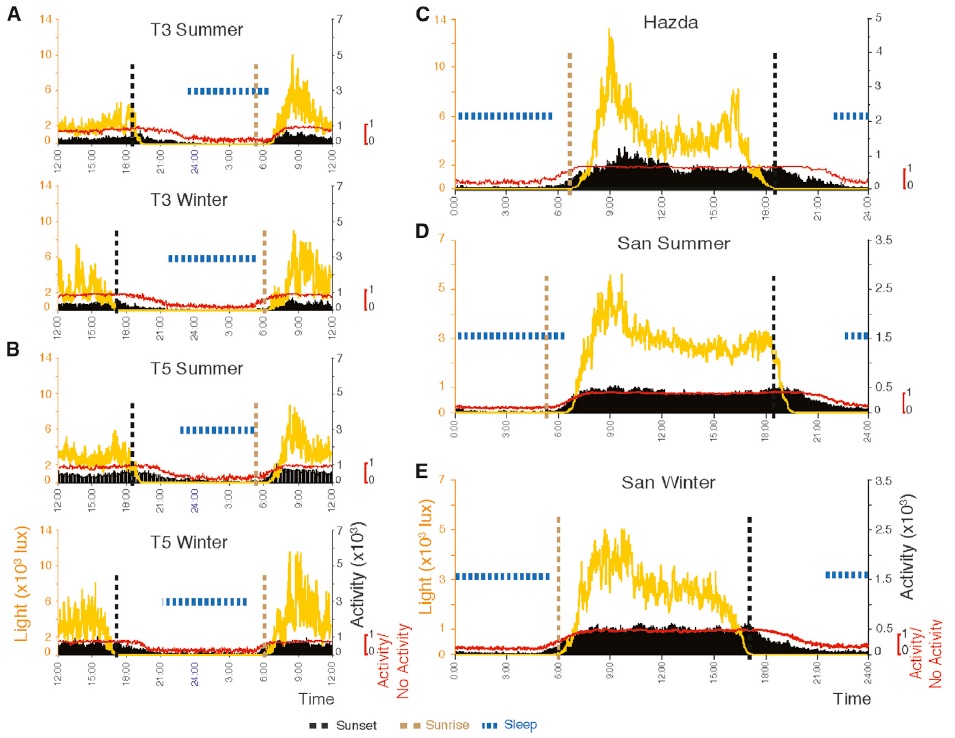
The patterns are interesting. The hunter-gatherer/horticulturalists sleep on average 6.4 hours a day, with one more hour in winter than in summer. Most surprising, they fall asleep about 3.3 hours after sunset, during the nightly period of falling temperature. Further, they usually awaken before sunrise, when the daily temperature is lowest.
From a lighting perspective, it is equally interesting that light exposure was maximal in the morning and greatly decreased at noon, with all three groups seeking shade (FIG. 2). This is likely attributable to all three groups living in the tropics, but it has the effect of providing maximal light activation of the suprachiasmatic nucleus (SCN) and its influence on circadian rhythms in the morning.
From this, the authors surmise that the daily cycle of temperature change, “largely removed from modern sleep environments,” may be more important than daily changes in illumination in regulating sleep patterns. With near-constant temperatures in our offices and residences (and presumably sleep laboratories), temperature changes become yet another variable in establishing a baseline for circadian rhythm disruption studies.
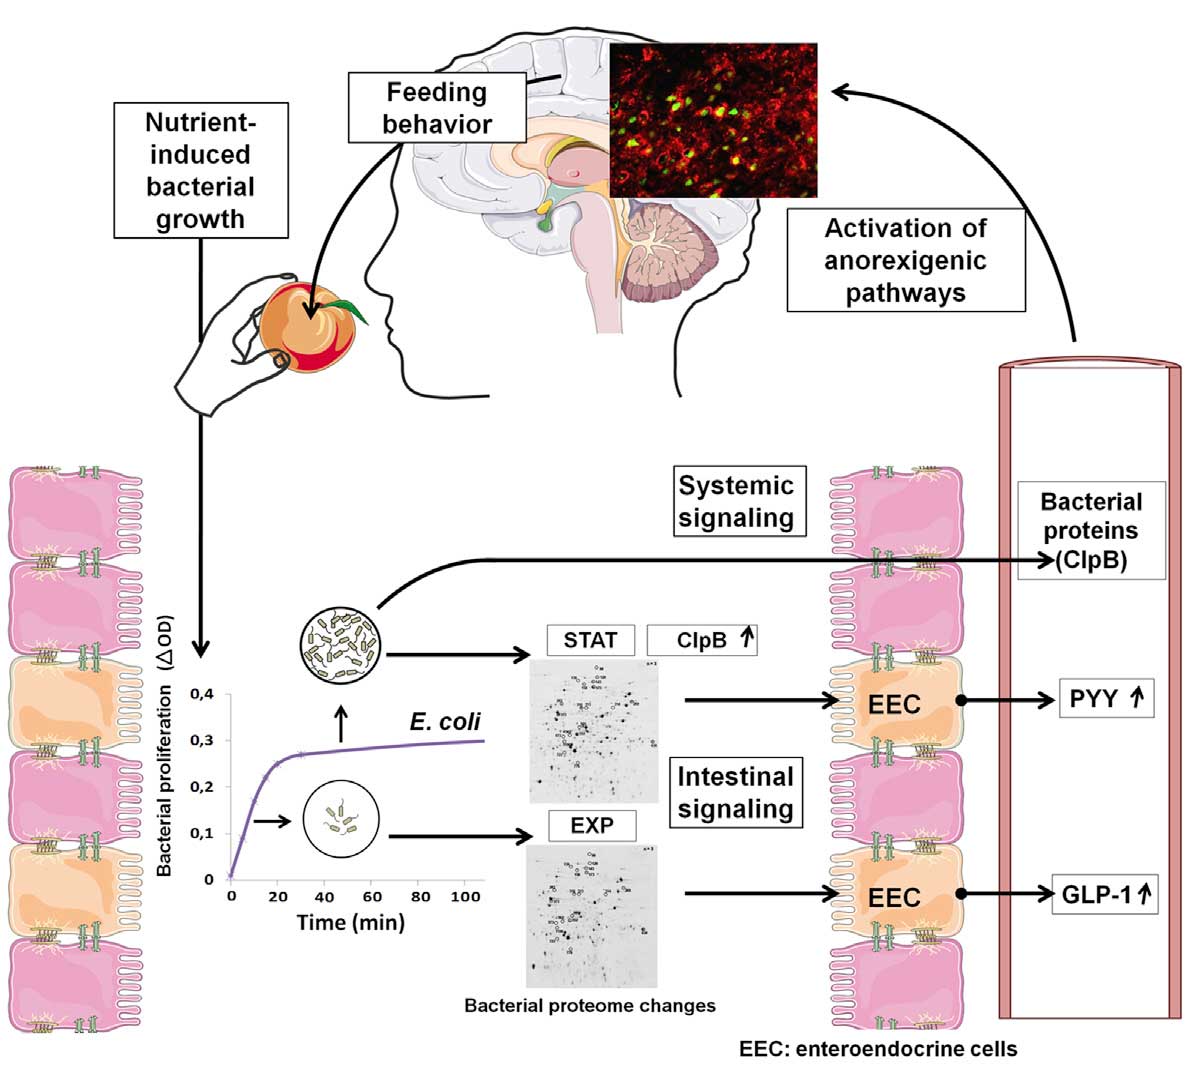
Illuminance, color, ambient temperature … could it get any more complicated? Yes, of course! A paper published just today in Cell Metabolism (Breton et al. 2015) has shown that our appetites for food are controlled not only by our brains, but by intestinal bacteria telling us via proteins they produce that they are sated, and that we should stop eating on their behalf. Designing experiments to elucidate circadian rhythm behavior therefore involves much more than simply dimming the lights. When and what the test subjects eat or drink is a critical factor in designing repeatable and relevant circadian rhythm experiments.
So what does this say about the Kruithof curve?
Circadian Kruithof
The problem with ascertaining preferences of any kind is that experiments need to be designed to control all the factors that may be involved. In doing so, the resultant laboratory conditions are often far removed from the real world.
This is precisely the problem with the Kruithof curve studies such as Bodman (1967), Boyce and Cuttle (1990), Davis et al. (1990), and others — they all (necessarily at the time) relied on constant CCT light sources, and ignored the test subjects’ circadian rhythm states.
Surprisingly, a review of the academic literature on this topic reveals … almost nothing. The closest relevant discussion is Poldma (2009), in which the author merely proposes “integrating [static] color and light theories with new contexts of dynamic, integrated human experiences of color and light in interior spaces.” Ellis et al. (2013a, 2013b) considers luminaire color temperature, but only in the context of matching daylight CCT for elderly patients with dementia.
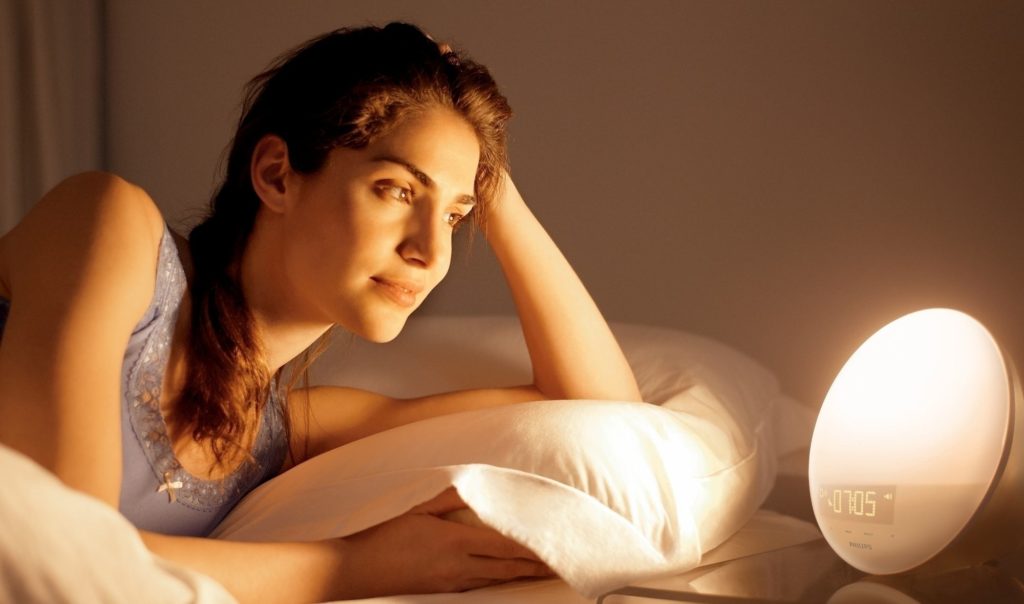
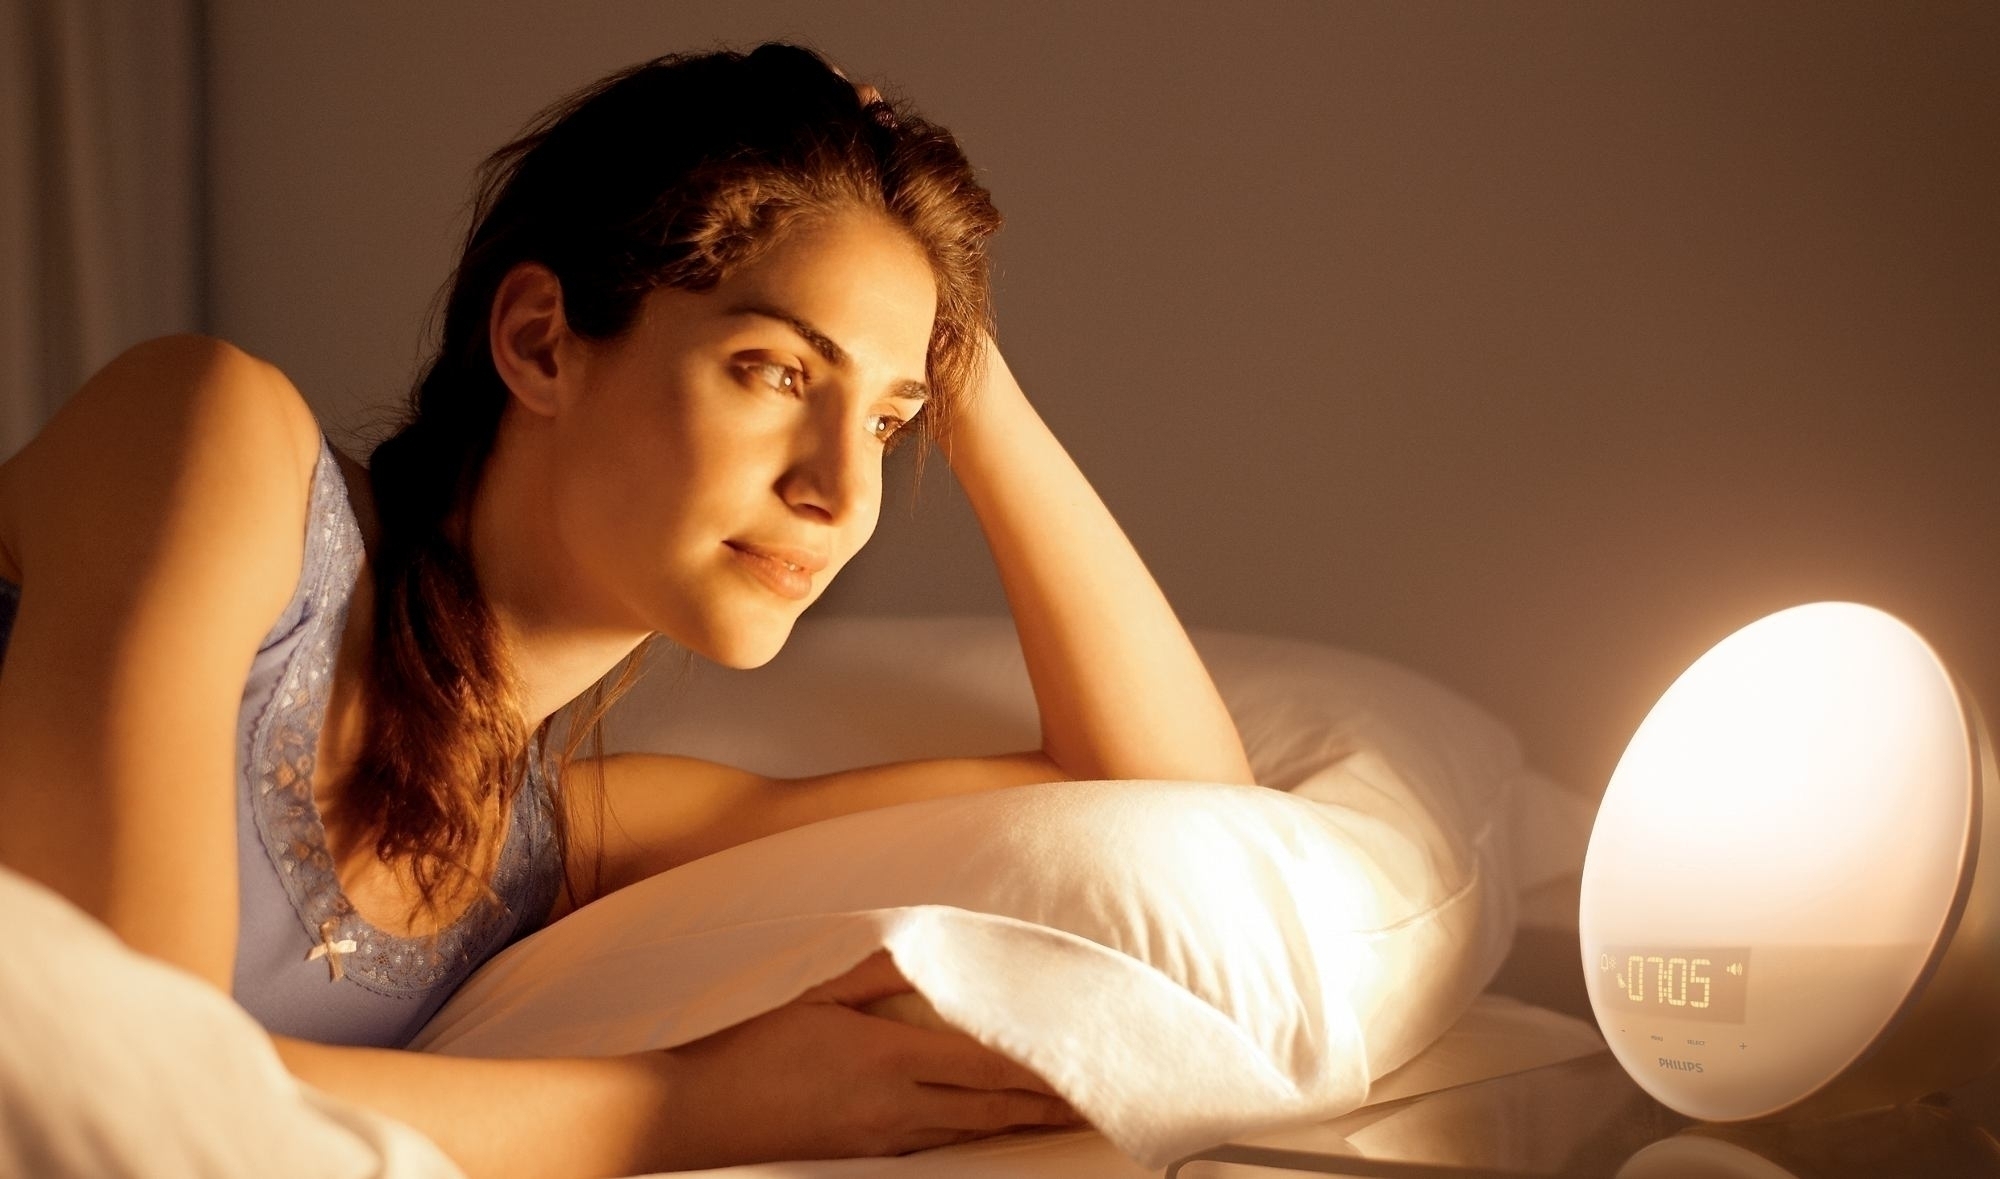
The evidence of Walmsley et al. (2015) suggests that our preferences for CCT versus illuminance may be intimately associated with the state of our circadian rhythms. The popularity of products such as the Philips Wake-Up Lights with their simulated sunrise colors would certainly indicate that this is the case.
There are of course many other examples, including “romantic mood” lighting in restaurants and CCT preferences for outdoor street and area lighting in residential areas. Our CCT preferences may vary throughout the day based on the state of our circadian rhythms and our activities.
At the end of the day, the modern interpretation of the Kruithof curve as shown in FIG. 1 remains “thoroughly debunked.” (The original curve presented by Kruithof in 1941 addressed a different issue.) However, it provides a framework for further research focused on human-centric lighting and circadian rhythms.
The problem, of course, lies in how to design an experiment that quantifies these preferences. It may be that the problem is intractable, at least in a laboratory setting. Perhaps the best answers will come from crowdsourced experiments — give millions of people the ability to change the luminaire CCTs in their environments and see what they prefer.
Today, this is mostly a theoretical approach. However, with the expected deployment of pervasive Internet-of-Things device in every luminaire over the coming few years, the necessary data will become available. Such an experiment may then be as simple as writing an appropriate search string for Google Analytics to process.
References
Ashdown, I. 2006. “Changing White Light,” LD+A 36(12):45-48 (December).
Bodman, H. W. 1967. “Quality of Interior Lighting Based on Luminance,” Transactions of the Illuminating Engineering Society of Great Britain 32(1):22.
Boyce, P. R., and C. Cuttle. 1990. “Effect of Correlated Colour Temperature on the Perception of Interiors and Colour Discrimination,” Lighting Research and Technology 22(1):19-36. (DOI: http://dx.doi.org/10.1177/096032719002200102)
Breton, J., et al. 2015.”Gut Commensal E. coli Proteins Activate Host Satiety Pathways following Nutrient-Induced Bacterial Growth,” Cell Metabolism (in press). (DOI: http://dx.doi.org/10.1016/j.cmet.2015.10.017)
Davis, R. G., and D. N. Ginthner. 1990. “Correlated Color Temperature, Illuminance Level, and the Kruithof Curve,” Journal of the Illuminating Engineering Society 19(1):27-38. (DOI: http://dx.doi.org/10.1080/00994480.1990.10747937)
Ellis, E. V., et al. 2013a. “Auto-tuning Daylight with LEDs: Sustainable Lighting for Health and Well-being,” Proc. ARCC 2013, pp. 465-473.
Ellis, E. V., et al. 2013b. “Chronobioengineering Indoor Lighting to Enhance Facilities for Ageing and Alzheimer’s Disorder,” Intelligent Buildings International Vol. 5 Supplement 1. (DOI: http://www.dx.doi.org/10.1080/17508975.2013.807764)
Kruithof, A. A. 1941. “Tubular Luminescence Lamps for General Illumination,” Philips Technical Review Vol. VI, No. 3, pp. 65-73.
Poldma, T. 2009. “Learning the Dynamic Processes of Color and Light in Interior Design,” Journal of Interior Design 34(2):19-33. (DOI: http://dx.doi.org/10.1111/j.1939-1668.2008.01017.x)
Walmsley, L., L. Hanna, J. Mouland, F. Martial, A. West, A. R. Smedley, D. A. Bechtold, A. R. Webb, R. L. Lucas, and T. M. Brown. 2015. “Colour as a Signal for Entraining the Mammalian Circadian Clock,” PLOS Biology, April 17. (DOI: http://dx.doi.org/10.1371/journal.pbio.1002127)
Yetish, G., et al. 2015. “Natural Sleep and Its Seasonal Variations in Three Pre-industrial Societies,” Current Biology 25:1-7. (DOI: http://dx.doi.org/10.1016/j.cub.2015.09.046)