Ian Ashdowna, Chris Jacksonb, Joel Spahnc, Todd Saemischd
a. SunTracker Technologies Ltd., Victoria, Canada. b. Lighting Analysts Ltd., London, UK. c, d. Lighting Analysts Inc., Littleton, CO.
Published: 2017/02/11 (Updated 2021/04/12)
Ceriss365 and DAYSIM are daylighting analysis software programs that perform climate-based annual daylight simulations, including the calculation of annual daylight metrics. This white paper compares their performance in terms of accuracy and calculation times. Average illuminance and spatial daylight autonomy values agree to within 8 percent, while Cerise365 is approximately 250 times faster than DAYSIM for a benchmark model.
NOTE: The climate-based annual daylighting software described in this white paper was previously implemented in Lighting Analysts’ LICASO daylighting design product. This product was not a commercial success, and has since been removed from the market.
Climate-Based Daylight Metrics
Quoting from the IES Lighting Handbook, Tenth Edition,5 the definition of daylight autonomy seems simple enough: “… the measure of the percentage of the operating period (or number of hours) that a particular daylight level is exceeded throughout the year.” It includes spatial daylight autonomy (sDA)6, which “… reports the percentage of sensors (or building area) that achieves a minimum daylight illuminance level (typically 300 lux) for a minimum percent of the analysis year (time).” Other dynamic daylight metrics include continuous daylight autonomy (cDA)6, maximum daylight autonomy (mDA)6, useful daylight illuminance (UDI)9 and more, all with seemingly simple definitions.
Simple to say, yes, but calculating these metrics is another matter entirely. Behind the scene are devilishly complex algorithms that require massive amounts of computation. Until recently, the only options for professional lighting designers and architects have been based on the justly acclaimed Radiance suite of lighting simulation tools. A typical example is DAYSIM, which is described as “… validated, Radiance-based daylighting analysis software that models the annual amount of daylight in and around buildings.”
Cerise365 is the first climate-based annual daylight simulation software program that is not based on Radiance. More than this, it is not even based on the Radiance computational model of ray tracing. Rather, it relies on proven radiosity methods1, and in particular the algorithms that have been driving Lighting Analysts’ AGi32 and ElumTools lighting design and analysis software products for nearly two decades. (See AllThingLighting‘s blog article Climate-Based Daylight Modeling for further details.)
… but enough gratuitous advertising. The intent of this white paper is to compare the performance of Cerise365 and DAYSIM in terms of accuracy and calculation times. This is not a case of which program is better suited for any given application, but simply to see whether the two programs are indeed comparable.
Benchmark Model
The spatial daylight autonomy metric has been adopted for use with green building certification by the US Green Building Council10 and the International WELL Building Institute.3 However, the United Kingdom Education Funding Agency mandates the use of both spatial daylight autonomy and useful daylight illuminance daylight metrics for its Priority School Building Programme.4 The benchmark model used in this white paper is therefore based on a typical 55-m2 classroom in accordance with the PSBP baseline design.
The benchmark model consists of four identical rooms facing north, south, east, and west, with each room having two glazed windows (FIG. 1). Each room measures 7.5 meters long by 7.0 meters wide by 3.2 meters high.
Each window measures 1.68 meters wide by 2.0 meters high, is positioned 0.85 meters above the floor and 0.5 meters from the closest wall, and has a transmittance of 70 percent.
The floor reflectance is 20 percent, the wall reflectance is 60 percent, and the ceiling reflectance is 80 percent.
A virtual ground plane with 18 percent reflectance is assumed for Cerise365. The equivalent for Radiance (and hence DAYSIM) is a 180-degree glow source (essentially an upside-down sky) with uniform luminance that is the horizontal illuminance due to the diffuse skylight and direct sunlight multiplied by the ground plane reflectance.8 DAYSIM allows the user to specify the ground plane reflectance, with a default value of 20 percent.
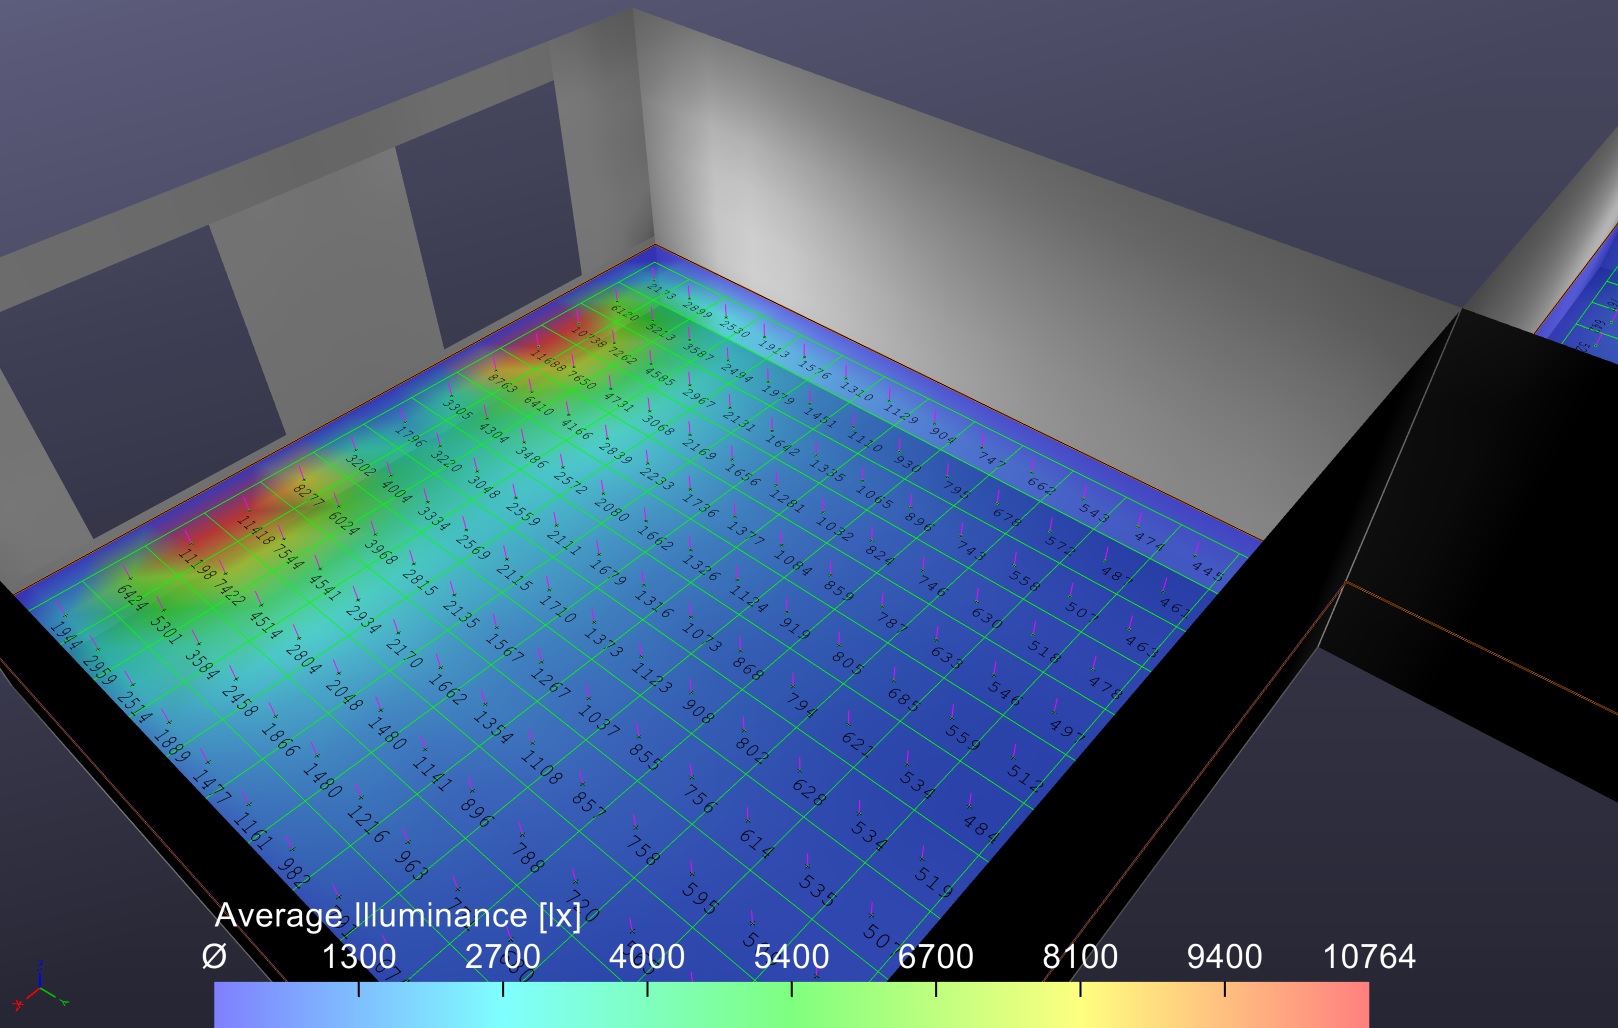
A grid of 15 by 15 virtual photometers, spaced at 0.5-meter intervals, is centered in each room, with a mounting height of 0.75 meters (FIG. 2).
Simulation Parameters
The TMY3 weather file is LONDON/GATWICK-GBR (37760), with a site location of 51.15 degrees north and 0.18 degrees west. All simulations were run in one-hour increments for the entire year, with occupied hours of 8:00 AM to 4:00 PM for a total of 2,920 hours, and Daylight Saving Time from March 29th to October 25th.
DAYSIM
DAYSIM uses a modified version of the Radiance utility program rtrace called rtrace_dc., where the ìdcî suffix represents “daylight coefficients.” Of the 46 user-specified parameters available for rtrace, rtrace_dc provides user access to 13 of them with default values (Table 1).
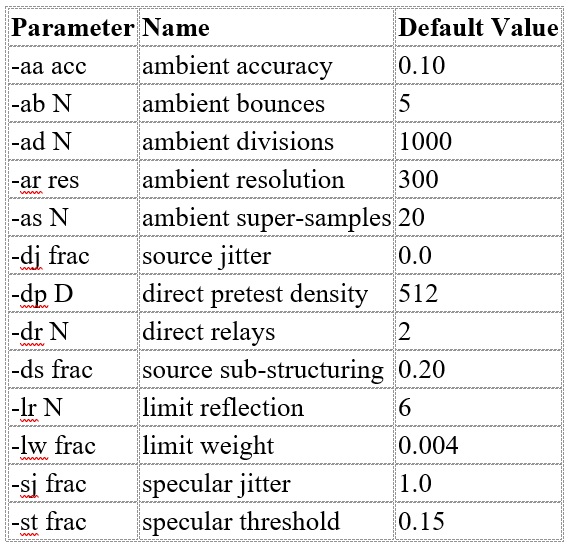
It is not obvious to DAYSIM users what effect these parameters will have on the calculations. However, the same parameters are available for the Radiance utility program rpict, and so reference can be made to http://radsite.lbl.gov/radiance/refer/Notes/rpict_options.html, with rendering artifacts related to the relevant parameters enumerated in Table 2.
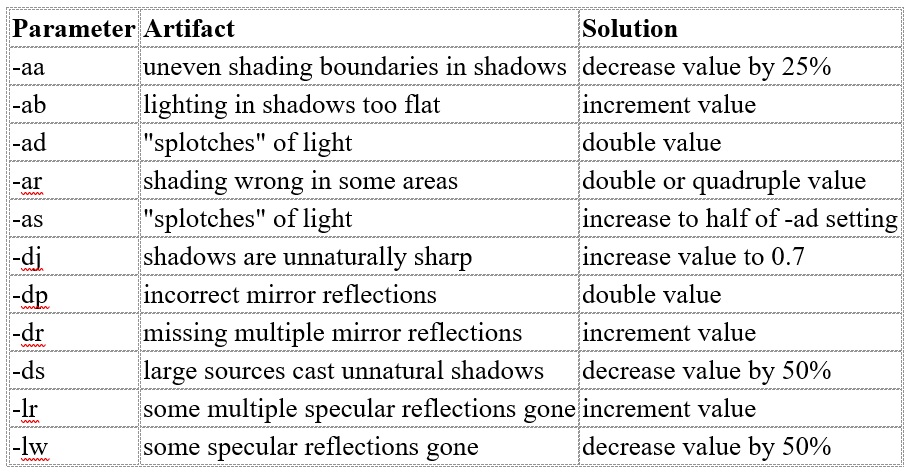
Some of these parameters are problematic, of course, in that their effects can only be seen in the renderings generated by rpict. Without access to these renderings, DAYSIM users have little choice but to accept its default values.
More obvious are the effects of the parameter values on the calculation times. These are (again from the rpict documentation) enumerated in Table 3.
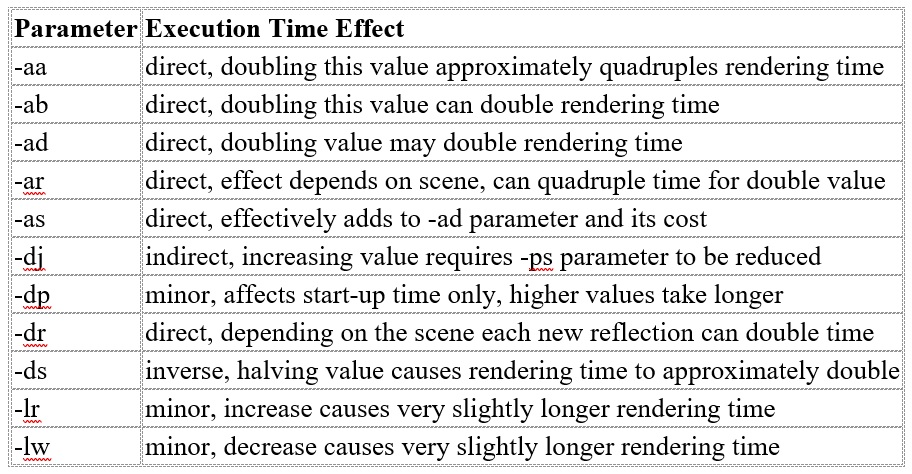
(The -ps parameter of rtrace is not accessible to the user, so presumably rtrace_dc modifies this parameter accordingly when the -dj parameter is changed from its default value.)
What is clear is that the -a* parameters can be very expensive in terms of calculation time, and should therefore be changed with considerable caution. In the absence of rpict renderings, however, the only indication of the effect of these parameters is on the uniformity of the virtual photometer readings.
To illustrate this point, FIG. 3 shows the isolux distribution of photometer readings for two sets of -a* parameter values, with all other parameters being set to their DAYSIM default values.
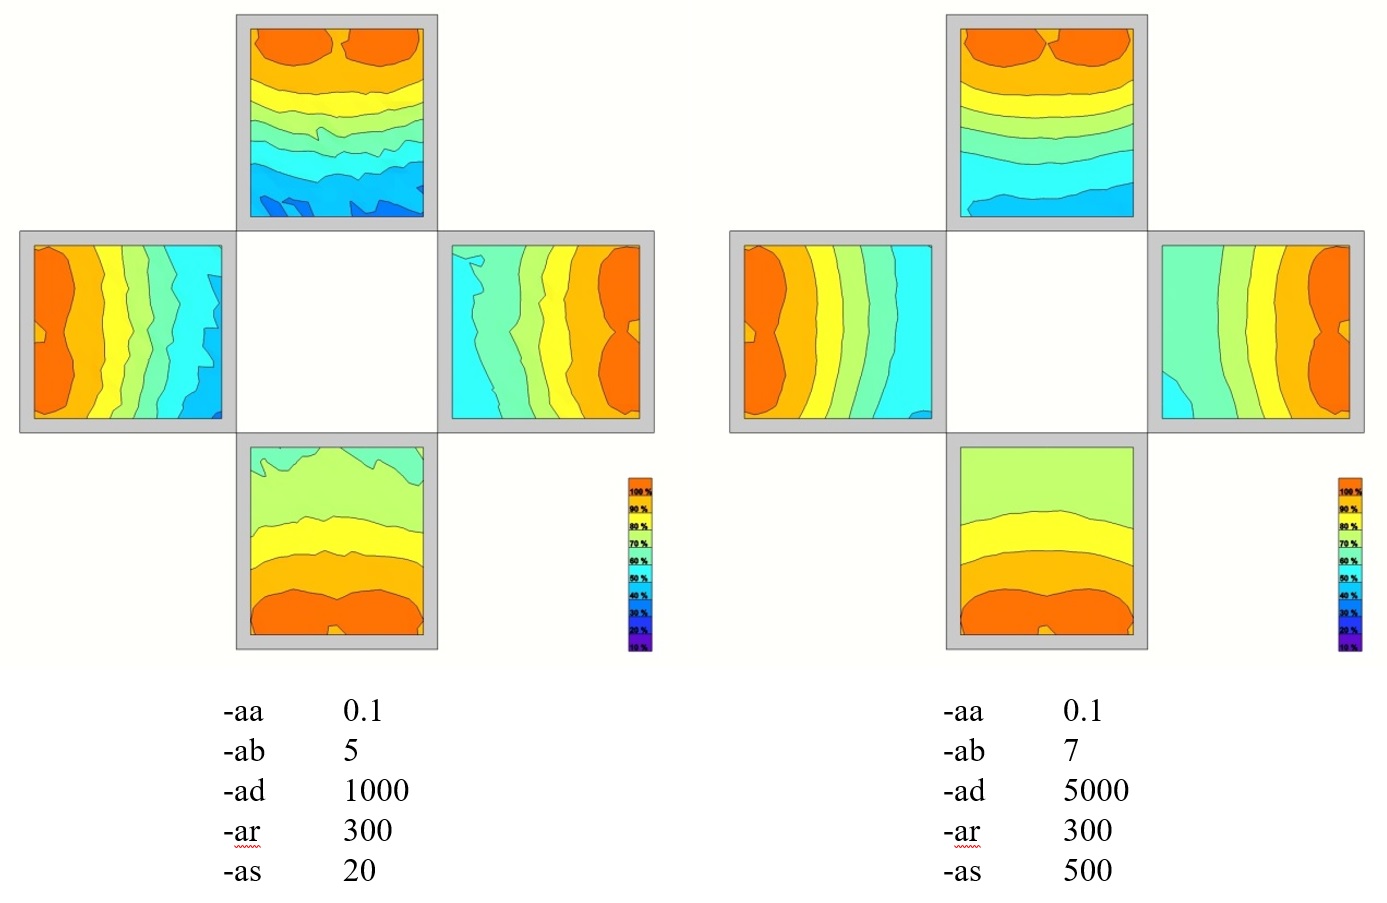
Simply by looking at the isolux distributions, it is evident that setting -ad to 1000 and -as to 20 results in “splotches” of light. Raising these parameter values to 5,000 and 500, respectively, appears to resolve this issue, but at the expense of increasing the calculation time. (In this particular example, the DAYSIM calculation time increased by a factor of 6.5 times.)
It should also be noted that the optimal -a* parameter values are scene-dependent. Mastery of these parameters requires an in-depth understanding of how Radiance interpolates its cached irradiance values.
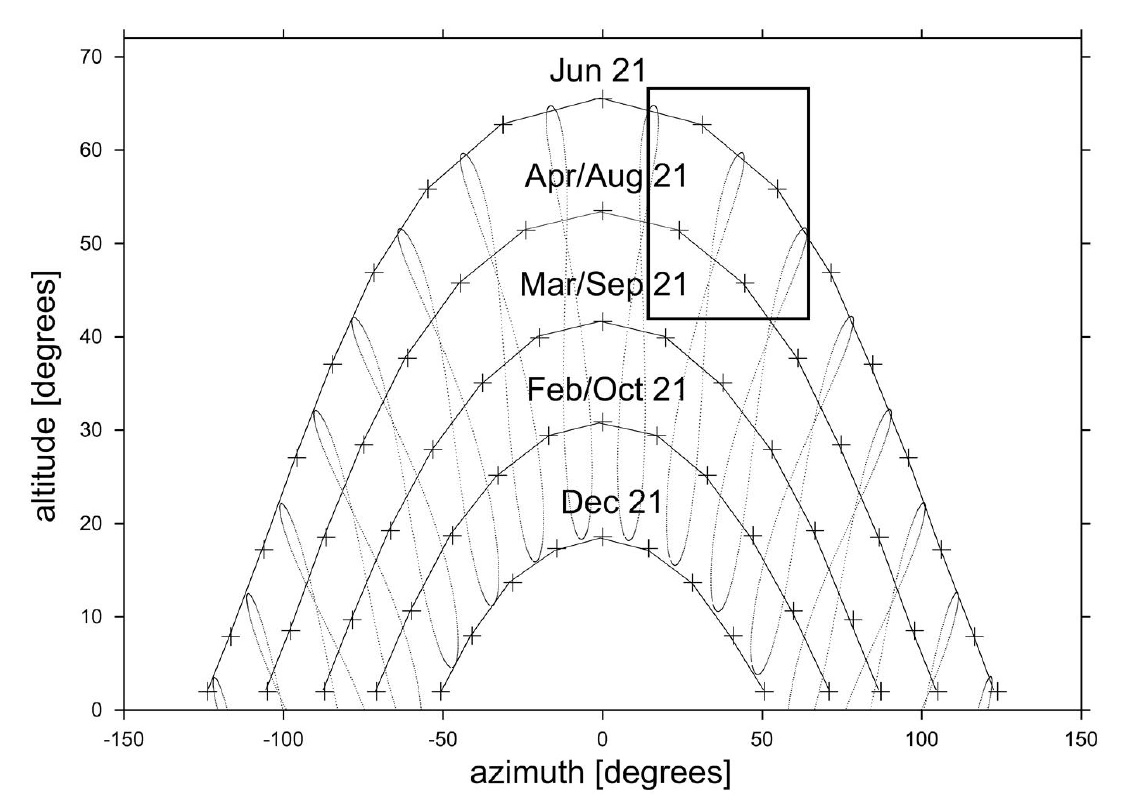
DAYSIM further offers three options for daylight coefficients:
- Original with 65 representative direct solar positions (e.g., FIG. 4)
- DDS (Dynamic Daylight Simulations) with 2,305 representative direct solar positions
- Shadow testing with hourly direct solar positions taken directly from TMY3 weather file records
In the third option, the actual solar position is bi-linearly interpolated from the representative direct solar positions for the first two options. (The third option is reportedly rarely used because it is very expensive in terms of calculation time.)
Cerise365
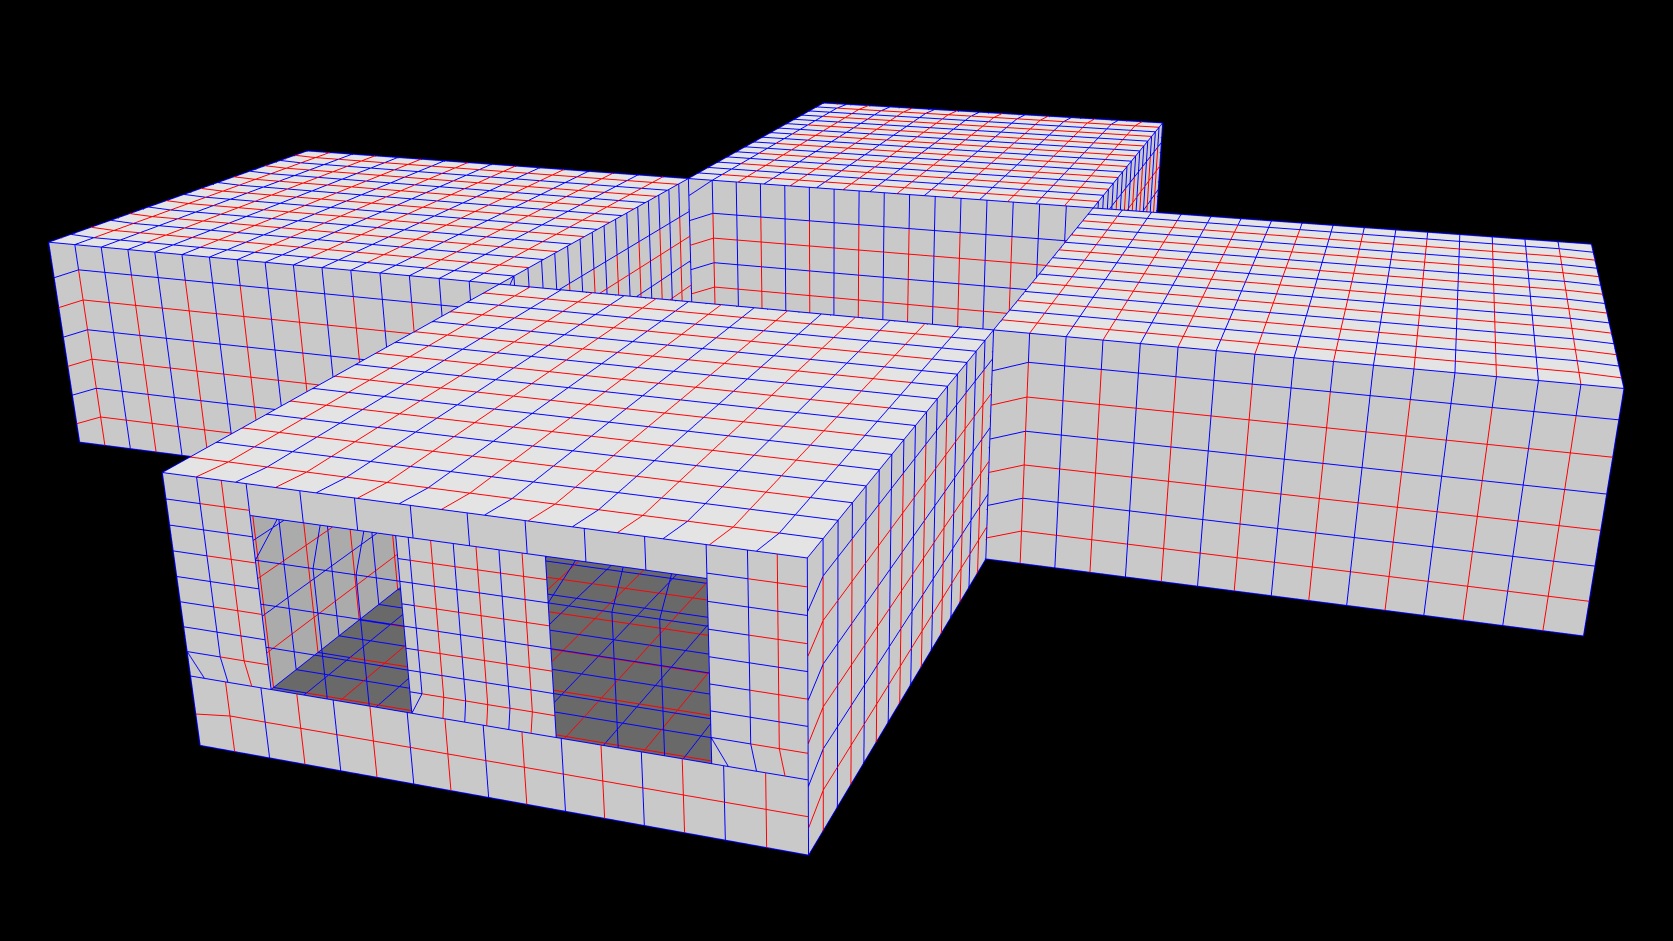
In accordance with radiosity methods, Cerise365 subdivides each surface into a two-level hierarchy of patches and elements (Fig. 5). For each interreflection, light is received by the elements of a patch and then reflected (and transmitted for translucent surfaces) from the center of the patch.1 The combined direct sunlight and diffuse daylight are interreflected (or ìbouncedî) between elements and patches in this way until mostly absorbed.
Compared to DAYSIM, Cerise365 has only four user-specified parameters for climate-based annual daylight modeling:
- Maximum surface patch area
- Maximum window patch area
- Number of elements per surface patch
- Stopping criterion for absorbed light
For the benchmark model, the maximum patch area is 1.0 m2, the number of elements per patch is four, and the stopping criterion is 99 percent. (That is, the bounces of light stop when 99 percent of the interreflected light is absorbed.)
Direct sunlight and diffuse skylight incident upon the windows are received by each window patch and transmitted into the room interior from the center of each patch. For the benchmark model, each window patch has an area of approximately 0.3 m2.
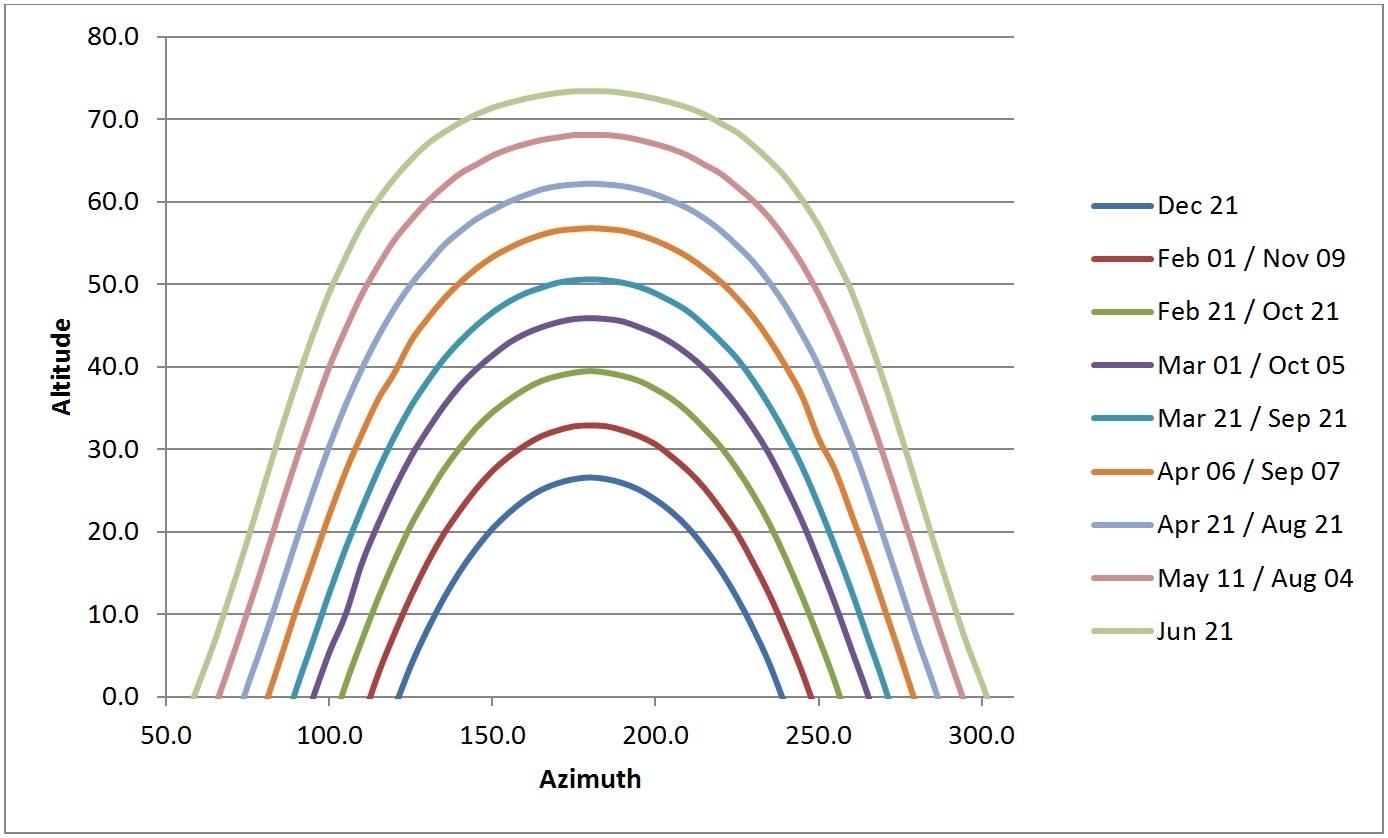
Cerise365 defines 120 representative direct solar positions, as shown in FIG. 6, where the representative positions are calculated for each hour on the specified dates. The actual solar position for any given hour and date is then linearly interpolated from the representative direct solar positions for the same hour. (See the blog article Climate-Based Daylight Modeling for further details.)
Cerise365 generates a variety of daylight metrics:
- Illuminance
- Basic Daylight Autonomy (DA)
- Continuous Daylight Autonomy (cDA)
- Maximum Daylight Autonomy (mDA / maxDA)
- Minimum Daylight Autonomy (minDA)
- Spatial Daylight Autonomy (sDA)
- Useful Daylight Illuminance (UDI)
- Annual Daylight Exposure (ADE)
- Annual Sunlight Exposure (ASE)
- Spatial Annual Sunlight Exposure (sASE)
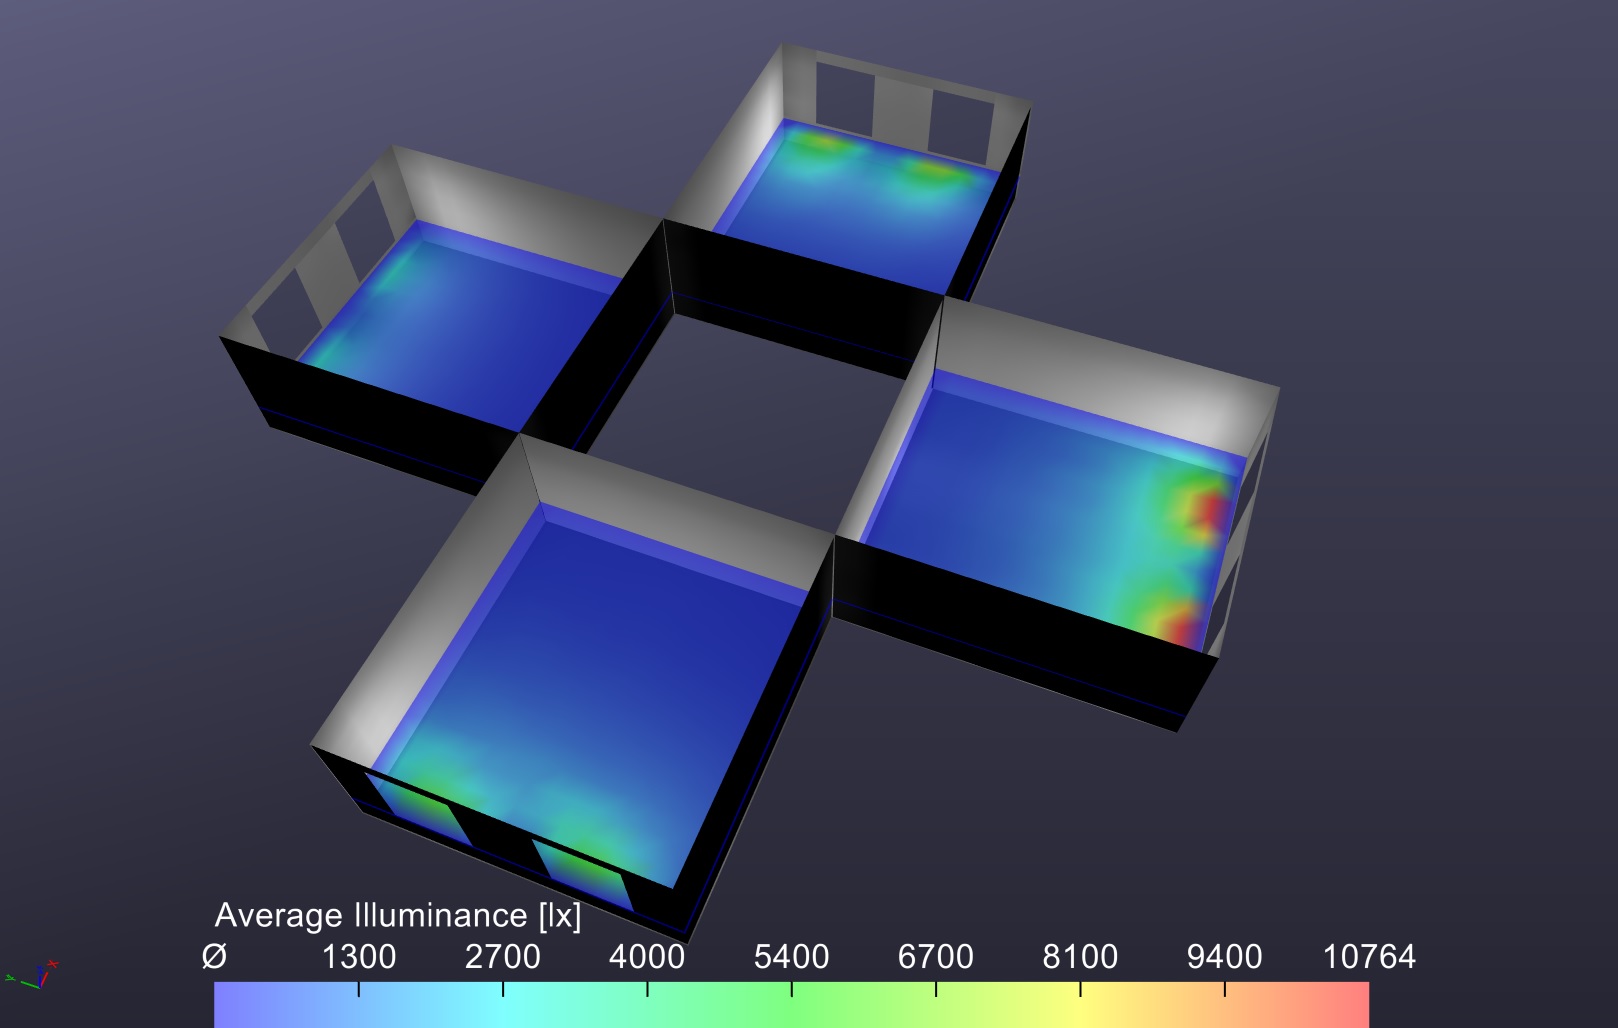
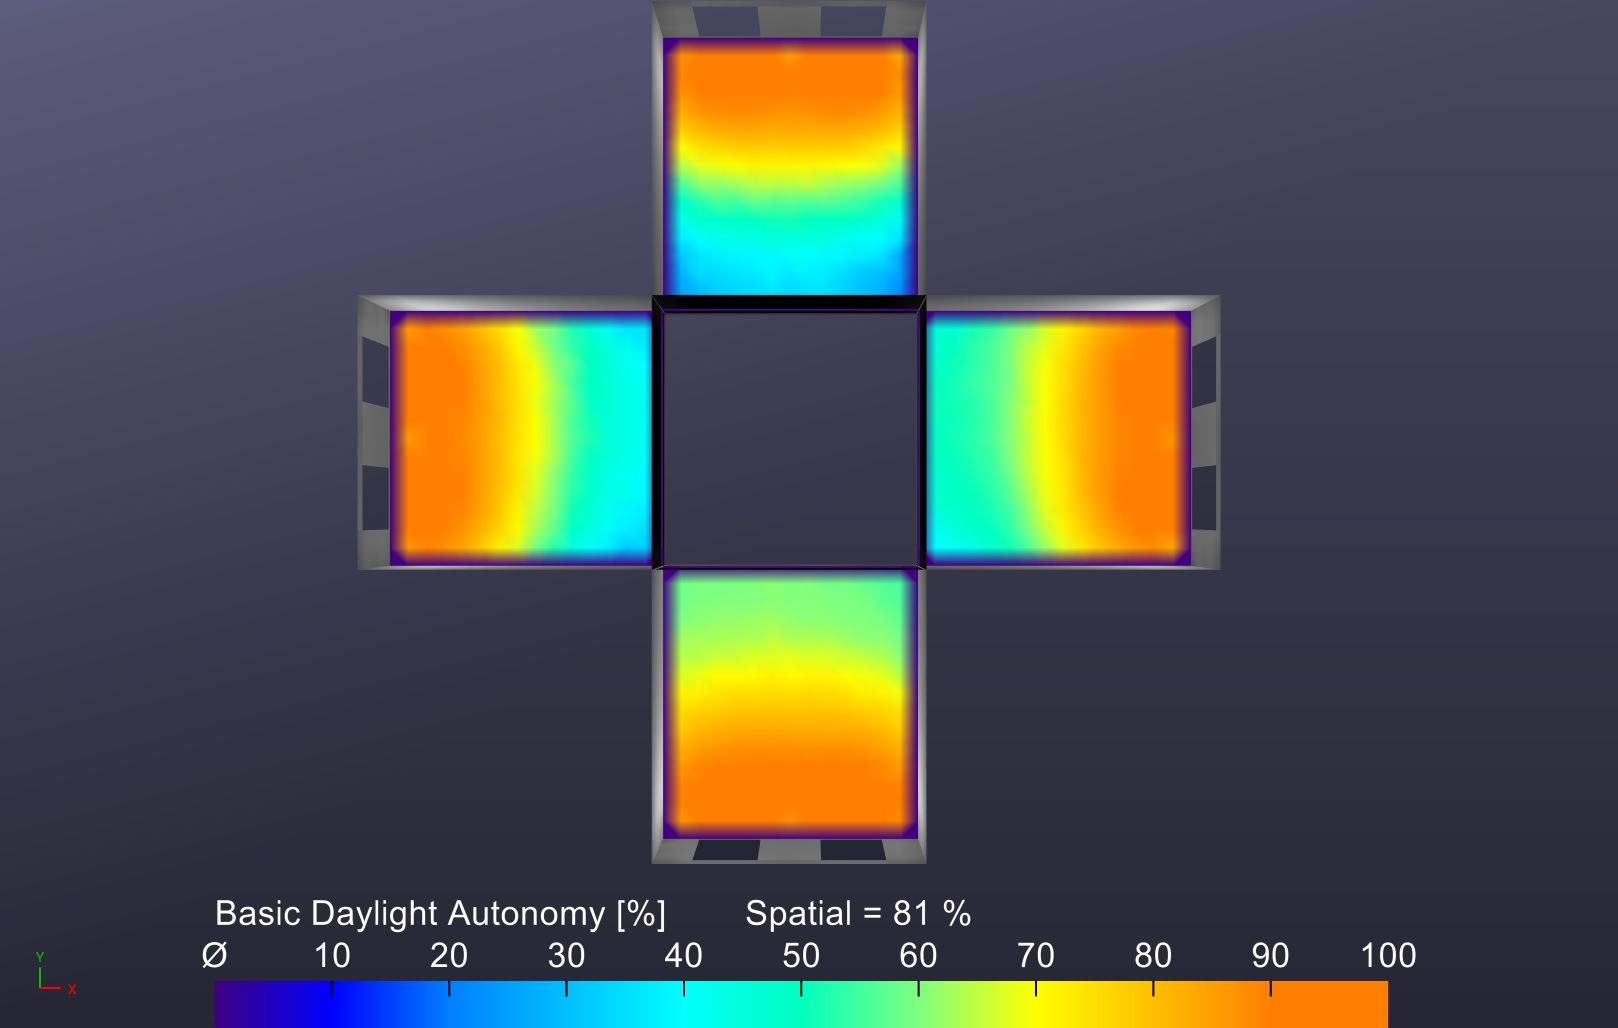
It also provides three-dimensional rendered views (e.g., FIG. 7) and animations of single days and the entire year. This enables the user to both analyze and visualize the distribution of daylight throughout the year.
Results
All tests were performed on a Windows 10 desktop computer with an Intel Core i7-4770K quad core CPU (3.5 GHz overclocked at 4.1 GHz) and 32 GB of random access memory
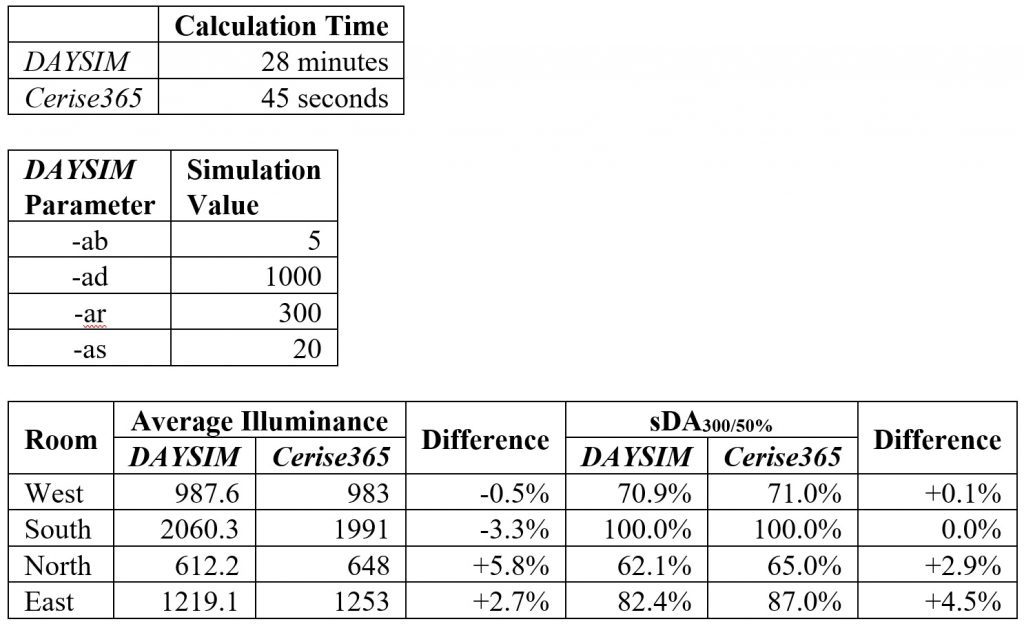
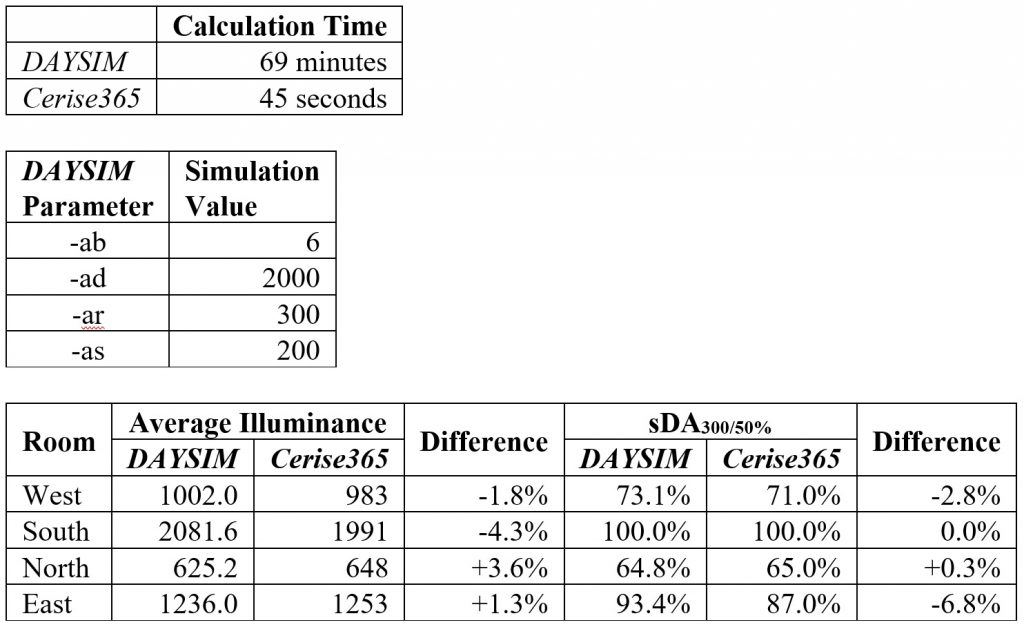
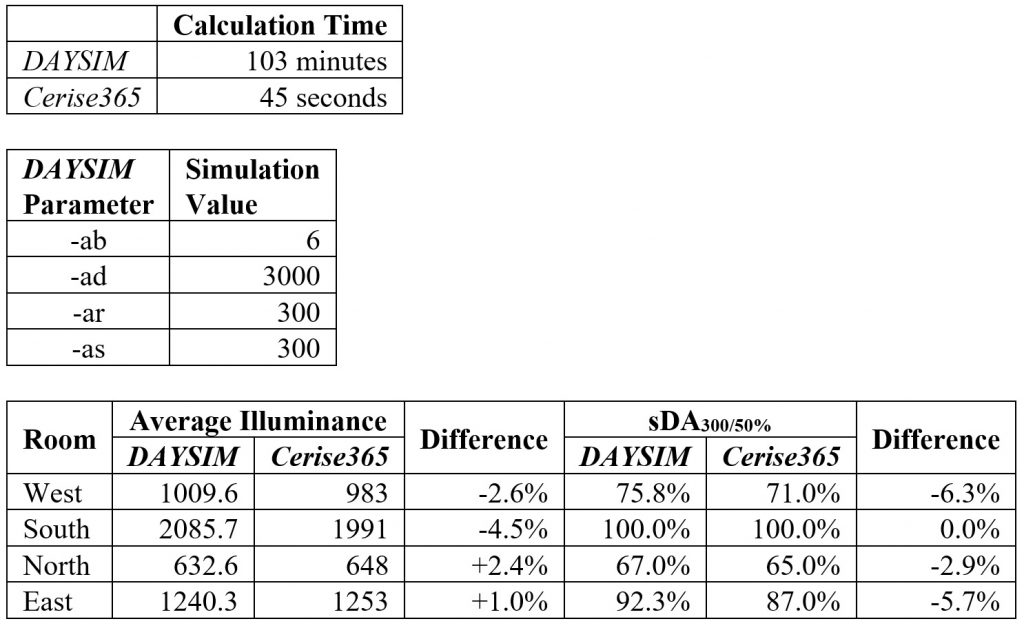
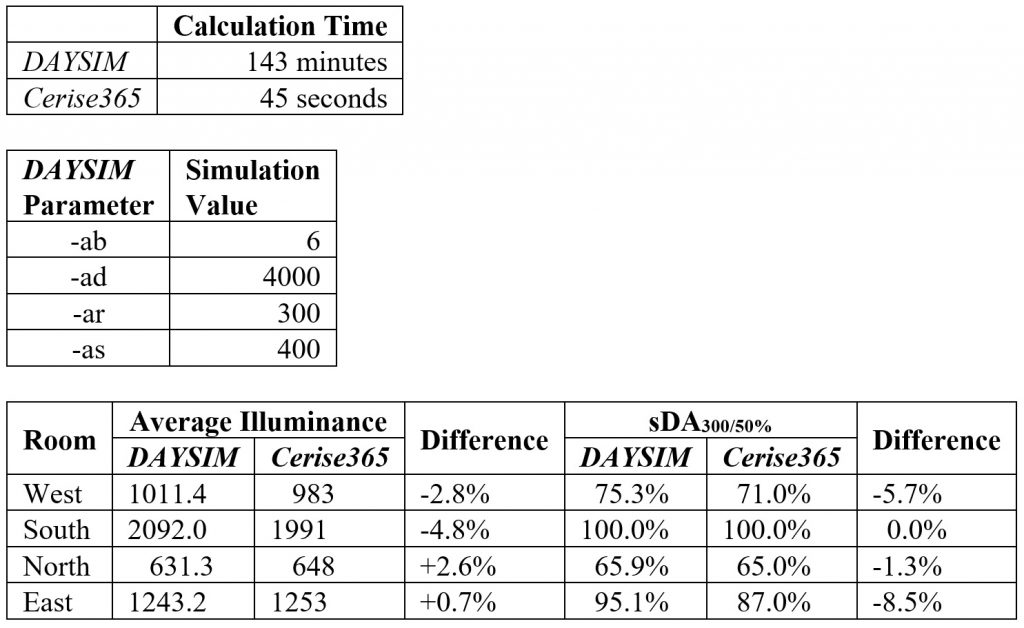
As previously noted, both the accuracy and execution time of DAYSIM is strongly dependent on the user-specified parameter values, as is evident from FIG. 3. Consequently, eight separate simulations were performed with different parameter settings for -ab, -ad, -ar, and -as, with each simulation being compared with the Cerise365 results. (Default values were used for all other DAYSIM parameters.)
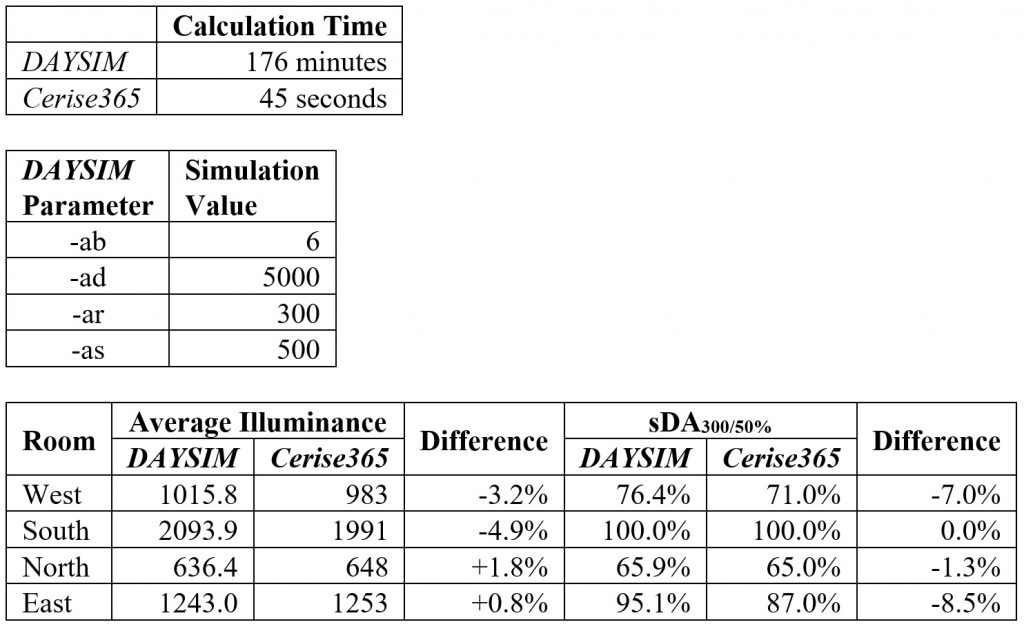
Two metrics were chosen for comparison purposes: average illuminance as measured by the virtual photometers, and spatial daylight autonomy for 300 lux and 50 percent minimum time (designated as sDA300/50% by IES LM-83-12).6 The benchmark results are presented in Appendix A.
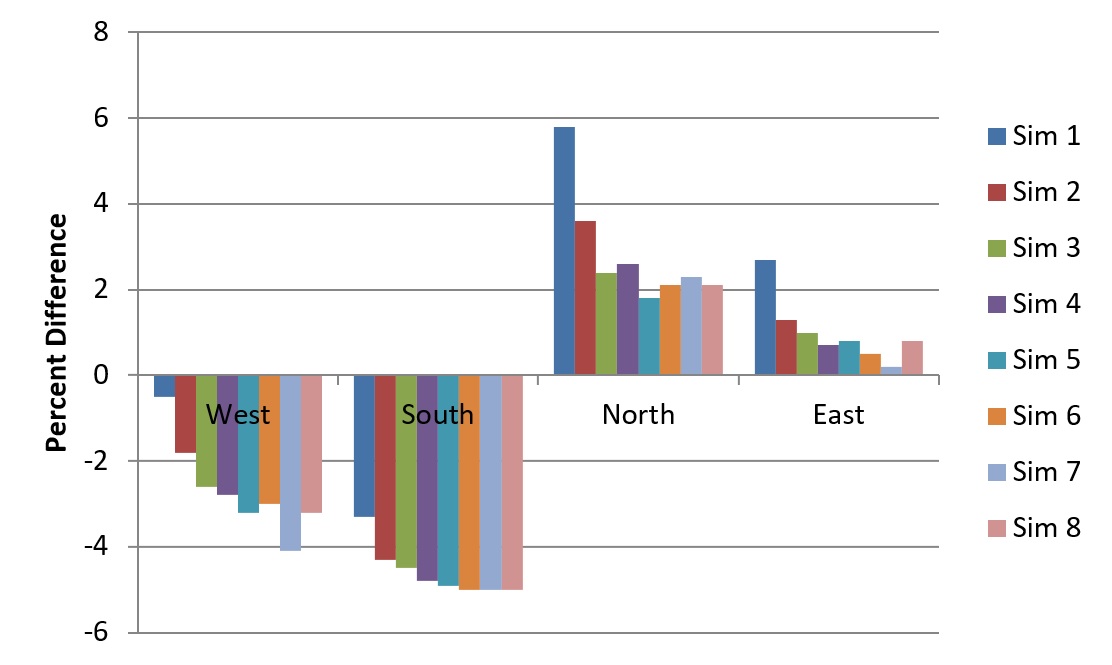
The DAYSIM versus Cerise365 average illuminance differences are plotted in Figure 8. Assuming that the DAYSIM simulations represent increasing accuracy with each simulation, it is evident that Cerise365 underestimates the average illuminance of the south room by 5 percent and the west room by 3 percent, and overestimates the average illuminance of the north room by 2 percent and the east room by 1 percent. Considering that DAYSIM and Cerise365 use completely different computational models, these differences are remarkably small.
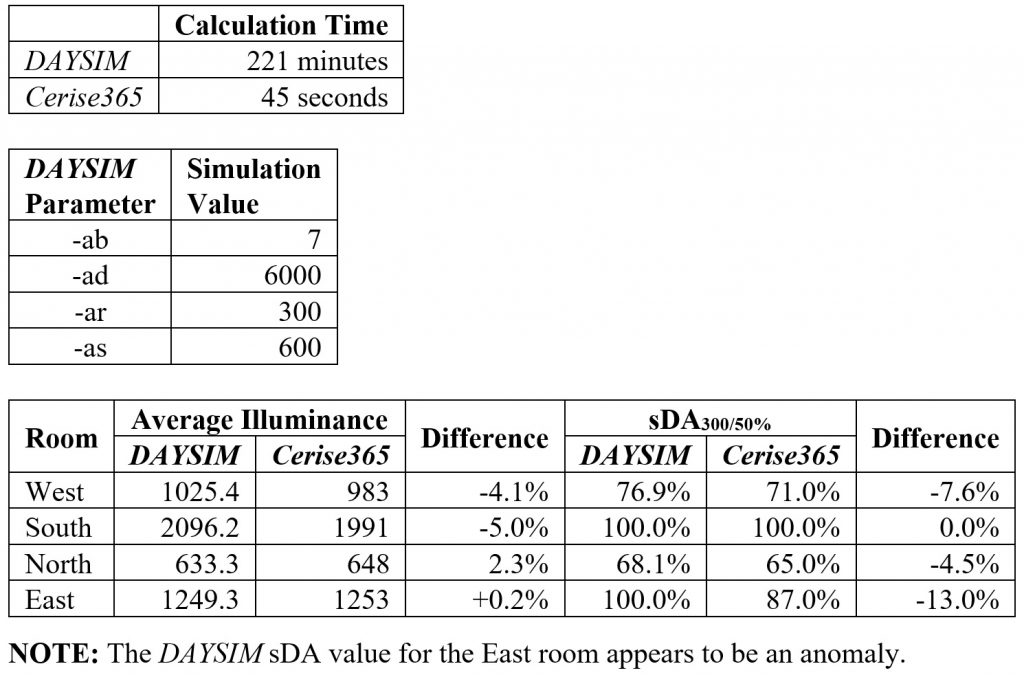
The DAYSIM versus Cerise365 sDA300/50% differences are plotted in Figure 9. Again assuming that the DAYSIM simulations represent increasing accuracy with each simulation, it is evident that Cerise365 underestimates the sDA of the west room by 8 percent, the north room by 4 percent, and the east room by 8 percent.
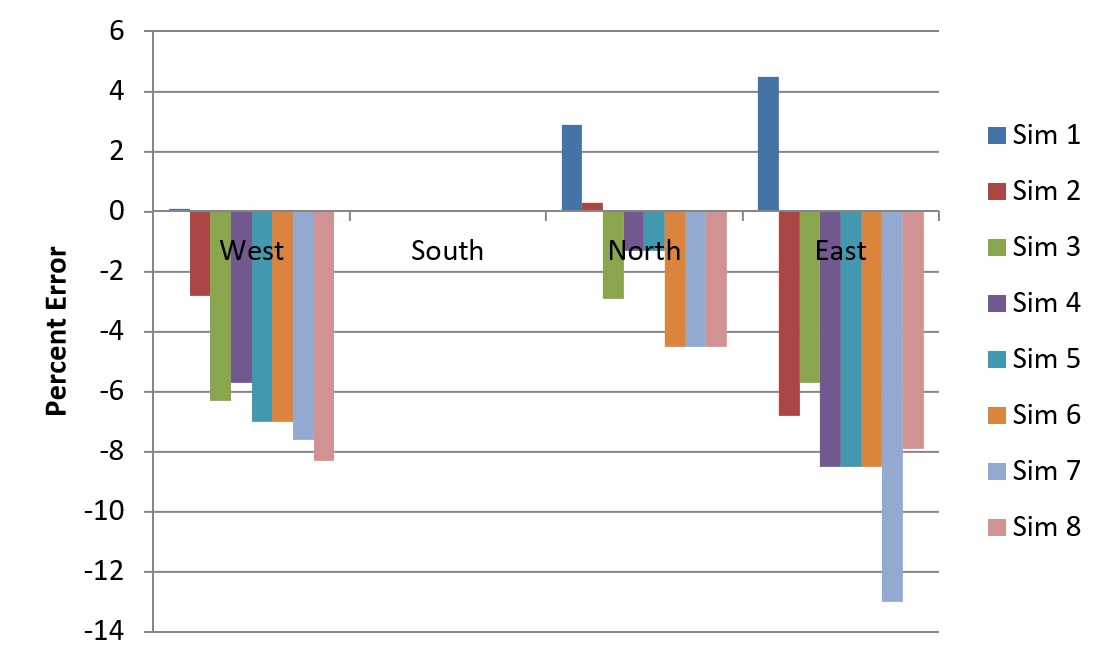
The DAYSIM sDA value for the east room appears to be a calculation anomaly, possibly due to a remaining “splotch” of light. Ray tracing in Radiance is a stochastic (i.e., random) process, and so this anomaly may not occur if the benchmark is executed on a different machine.
The execution times for the different simulations are summarized in Table 13.
| Simulation | DAYSIM Execution Time (minutes) | Cerise365 Comparison (45 seconds) |
| 1 | 28 | 37 times |
| 2 | 69 | 92 times |
| 3 | 103 | 137 times |
| 4 | 143 | 190 times |
| 5 | 176 | 234 times |
| 6 | 182 | 242 times |
| 7 | 221 | 294 times |
| 8 | 261 | 348 times |
The differences in execution time between Cerise365 and DAYSIM are perhaps surprising, but they are typical due to differences between the ray tracing and radiosity calculation models. Simply put, radiosity methods are better able to take advantage of scene redundancy between hourly calculations.
Conclusions
For both the average illuminance and spatial daylight autonomy metrics used in this benchmark comparison, it must be implicitly assumed that DAYSIM generates correct values. DAYSIM is described as “validated, Radiance-based daylighting analysis software,” but the simulations show that the two metrics converge to constant values only for Simulations 6 through 8. It is true that Radiance has been validated by a number of studies, but the accuracy of its photometric predictions is highly dependent on the parameters chosen for rtrace and, by extension, rtrace_dc.
Simulation 1 generates average illuminance results that differ by up to 6 percent from the converged values of Simulations 6 through 8. Similarly, the sDA results differ by up to 13 percent. Given this, the differences in results between DAYSIM and Cerise365 for Simulations 6 through 8 are arguably acceptable. (As an aside, differences of ±10 percent between predicted and measured illuminances are considered quite acceptable in electric lighting calculations.)
Regarding the difference in calculation times — Cerise365 is hundreds of times faster than DAYSIM — this must be put into perspective. For the past three decades, Radiance has been the gold standard for electric lighting and daylighting research, and DAYSIM has built upon this foundation by offering lighting researchers open-source software for dynamic daylight metrics, annual visual glare analysis, and electric lighting control. The innumerable user-specified parameters of rtrace and other Radiance tools (including DAYSIM) may make them difficult to master, but they are essential for lighting research.
SunTracker Technologies’ Cerise365 , by comparison, is a commercial product that is powered by SunTracker’s patented and patent-pending algorithms. It is intended for use as a climate-based daylighting simulation and analysis tool for professional lighting designers and architects.
In summary then, this benchmark analysis has shown that DAYSIM and Cerise365 generate comparable results in terms of dynamic daylight metrics such as spatial daylight autonomy. Cerise365 is clearly faster, but this comes at a cost for daylighting research, as there are fewer parameters to experiment with. Which software to choose depends, as always, on the user’s requirements.
References
- Ashdown, I. 1994. Radiosity: A Programmer’s Perspective. New York, NY: John Wiley & Sons.
- Bourgeois, D., C. F. Reinhart, and G. Ward. 2008. “Standard Daylight Coefficient Model for Dynamic Daylighting Simulations,” Building Research & Information 36(1):68-82.
- Delos Living. 2017. The WELL Building Standard v1 with January 2017 addenda. New York, NY: Delos Living LLC.
- 2014. EFA Daylight Design Guide, Lighting Strategy, Version 2. London, UK: The National Archives.
- 2010. The Lighting Handbook, Tenth Edition. New York, NY: Illuminating Engineering Society.
- 2013. IES RP-5-13, Recommended Practice for Daylighting Buildings. New York, NY: Illuminating Engineering Society.
- 2012. LM-83-12, IES Spatial Daylight Autonomy (sDA) and Annual Sunlight Exposure (ASE). New York, NY: Illuminating Engineering Society.
- Mardaljevic, J. 1998. “Daylight Simulation,” Chapter 6, in Rendering with Radiance, G. W. Larson and R. Shakespeare, Eds. San Francisco, CA: Morgan Kaufmann Publishers.
- Nabil, A., and J. Mardaljevic. 2006. “Useful Daylight Illuminances: A Replacement for Daylight Factors,” Energy and Buildings 38(7):905-913.
- 2013. LEED v4 BD+C: Schools — Daylight. Washington, DC: U.S. Green Building Council (www.usgbc.org).
Appendix A – Benchmark Results