Ian Ashdown, P. Eng., FIES, Senior Scientist, SunTracker Technologies Ltd.
Published: 2014/12/10
UPDATE 15/04/13 — This article was first published on December 10, 2014. A revised version was published as “LED Lighting for Horticulture” in the Mar/Apr 2015 issue of LED Professional Review (www.led-professional.com). This update includes information from the published article.
UPDATE 15/11/05 — due to several Excel spreadsheet errors, the lux-to-PPFD conversion factors presented in Table 2 were miscalculated. These errors have been corrected.
UPDATE 16/01/12 — the description of the Emerson effect has been corrected.
UPDATE 16/02/10 — Added discussion of calculating lux-to-PPFD conversion factors for overcast skies, as well as expanded notes and references on green and ultraviolet LEDs.
UPDATE 21/09/02 — Normalized lux to PPFD conversion factors.
Horticultural lighting these days is big business. As agricultural land becomes scarce, the weather becomes more unreliable, and the migration of people to megacities continues, it increasingly makes economic sense to cultivate plants indoors with electric lighting.
The problem is that lighting designers and horticulturalists generally do not speak the same language. Whereas we speak in terms of lumens and illuminance, horticulturalists speak in terms of photosynthetically active radiation (PAR) and photosynthetic photon flux density (PPFD). Ask for an explanation of these terms and you will hear talk of micromoles, and possibly microeinsteins, of photons. Instead of luminous flux, there is quantum flux. It can be very confusing, not to say frustrating.
We need however to understand each other. As the horticultural industry transitions from high-intensity discharge arc lamps such as high-pressure sodium (HPS) and metal halide (MH) to solid-state lighting (e.g., Massa et al. 2008, Mitchell et al. 2012, Nelson and Bugbee 2014), it becomes possible to tailor the spectral power distribution of multicolor-LED luminaires for individual crops and plant species. For lighting designers working with horticulturalists, the need to understand PAR and calculate PPFD values using lighting design software becomes critical.
Photosynthetically Active Radiation
Photosynthesis is the process used by plants to convert electromagnetic radiation ñ light ñ into chemical energy that is used for growth and development. All that is needed for this process is carbon dioxide (CO2), nutrients, and water. The process itself is not particularly efficient; only 4 to 6 percent of the absorbed radiation is converted into chemical energy (Zhu et al. 2010, Table 2). Still, it is the engine that drives most life on this planet.
Photosynthetically active radiation (PAR) is defined as electromagnetic radiation over the spectral range of 400 nm to 700 nm that photosynthetic organisms are able to use in the process of photosynthesis to fix the carbon in CO≠2 into carbohydrates. Horticulturalists measure PAR for both plant research and greenhouse lighting design (e.g., Barnes et al. 1993) using specialized photometers (e.g., Biggs et al. 1971).
A common unit of measurement for PAR is photosynthetic photon flux density (PPFD), measured in units of moles per square meter per second[1]. In this case, every absorbed photon, regardless of its wavelength (and hence energy), is assumed to contribute equally to the photosynthetic process. This is in accordance with the Stark-Einstein law, which states that every photon (or quantum) that is absorbed will excite one electron, regardless of the photon’s energy, between 400 nm and 700 nm. For this reason, photosynthetic photon flux is also referred to as quantum flux.
Whether a photon with a given wavelength is absorbed by a plant leaf is dependent on the spectral absorptance of the leaf, which in turn is determined largely by the leaf optical properties, including the concentration of plant pigments such as chlorophyll A and B, various cartenoids (carotenes and xanthophylls), and anthocyanins. The chlorophylls are responsible for the characteristic green color of leaves; the other pigments contribute to the yellow, orange, and red colors respectively of autumn leaves after the chlorophylls decompose.
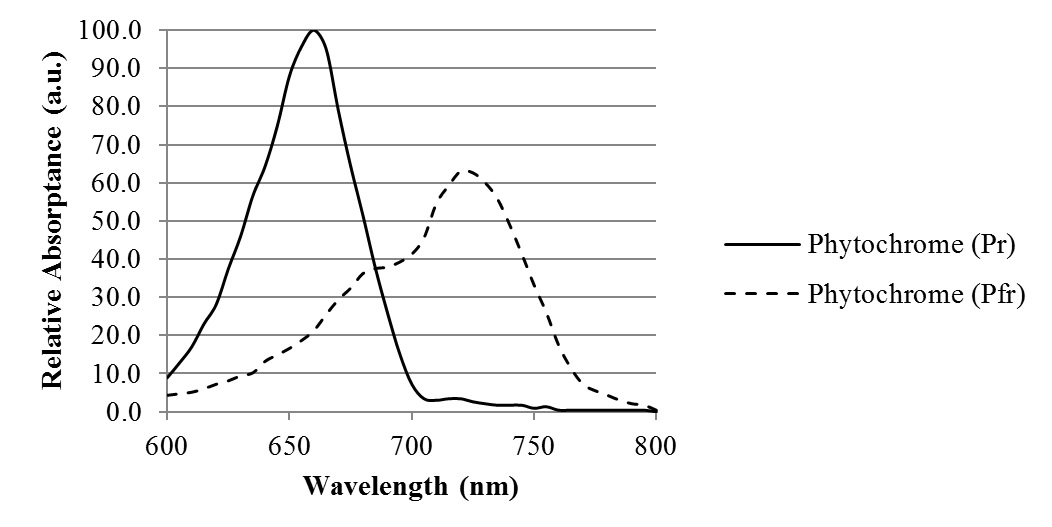
Typical absorptance spectra for chlorophyll A, chlorophyll B, beta-carotene, and two isoforms of phytochrome are shown in Figure 1. It must be noted, however, that these spectra are approximate. They are measured in vitro by dissolving the pigments as extracts in a solvent, which affects their absorptance spectra. By themselves, they suggest that blue and red LEDs alone are sufficient for horticultural applications. In reality, however, the situation is much more complicated.

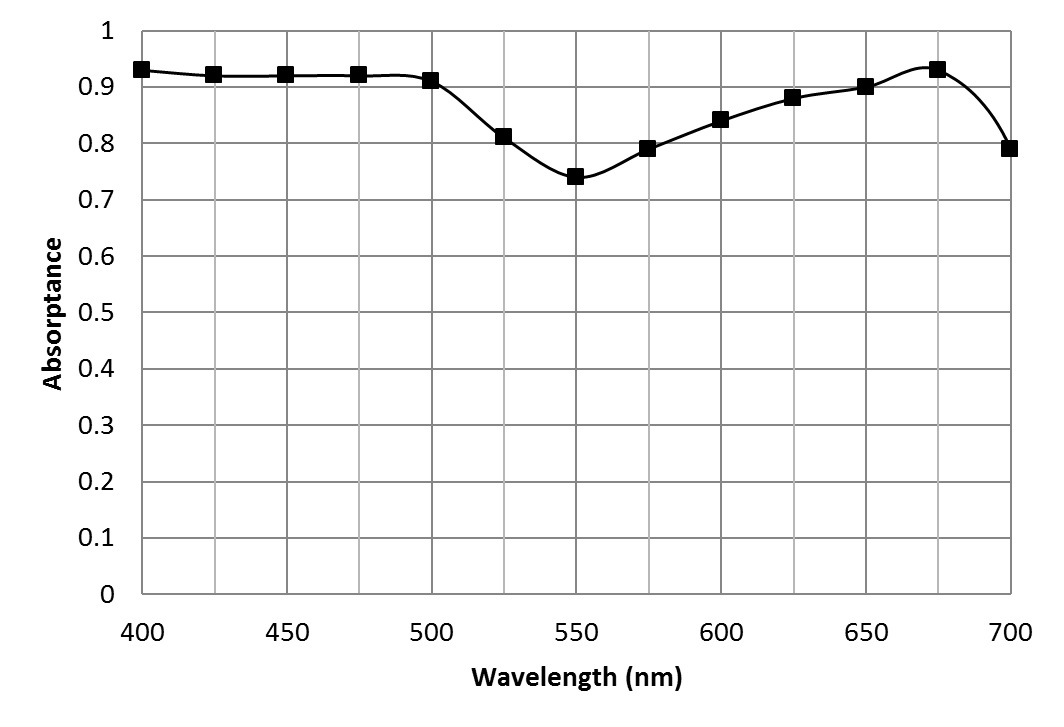
McCree (1972a) measured the spectral absorptance (FIG. 2) and quantum yield of CO2 assimilation for the leaves of 22 species of crop plants[2]. Taking the average measurements at 25 nm intervals for all plant species (Table 1), he produced the photon-weighted relative quantum yield (Table 1) that is representative of most crop plants.
| Wavelength (nm) | Relative Spectral Quantum Yield |
| 400 | 0.42 |
| 425 | 0.68 |
| 450 | 0.70 |
| 475 | 0.63 |
| 500 | 0.65 |
| 525 | 0.72 |
| 550 | 0.82 |
| 575 | 0.91 |
| 600 | 0.97 |
| 625 | 1.00 |
| 650 | 0.90 |
| 675 | 0.90 |
| 700 | 0.48 |
Table 1 – Relative Quantum Yield (average of 22 field species)
Yield Photon Flux
It is also possible to measure PAR in terms of energy rather than photons. The energy of a photon with wavelength λ is given by the Planck-Einstein relation:
E = hc / λ
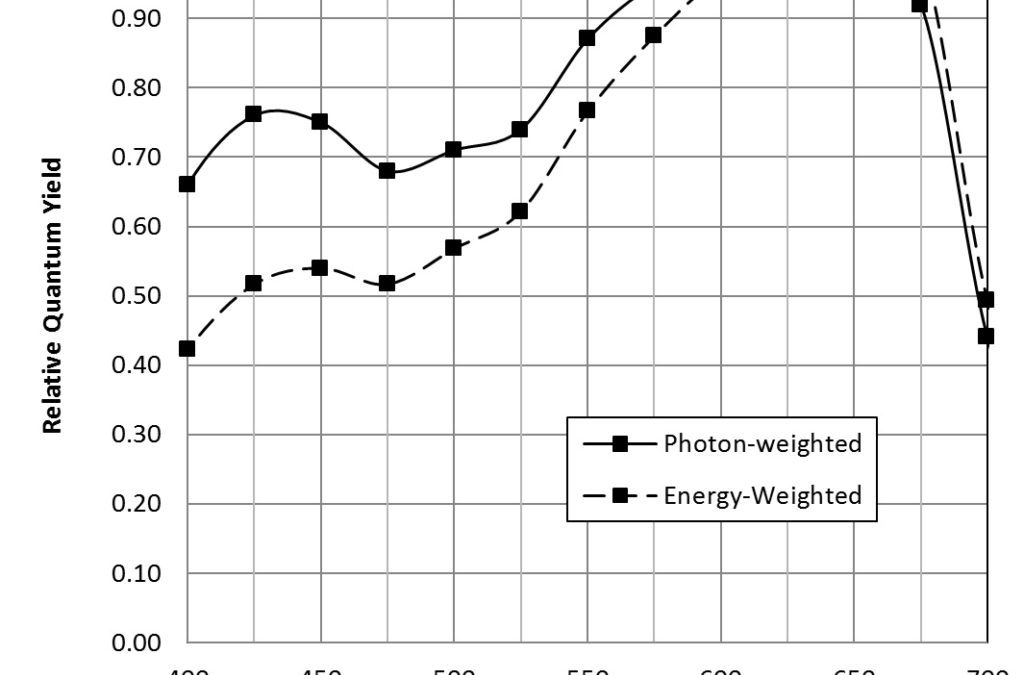
where E is the energy in joules, h is Planck’s constant (6.626 x 10⁻³⁴ joule-seconds), c is the speed of light (2.998 x 10⁸ meters per second), and λ is measured in meters. For example, one micromole of photons with a wavelength of 450 nm has 0.266 joules of energy. Scaling the photon-weighted relative quantum yield values by the wavelength and normalizing produces the energy-weighted relative quantum yield, also known as the action spectrum (FIG. 3). (An action spectrum is simply a plot of biological effectiveness as a function of wavelength of incident light.)
The energy-weighted photosynthetic photon flux is measured in watts (joules per second), and is referred to as the yield photon flux (YPF). (In terms of lighting design, it is synonymous with irradiance.) As shown by McCree (1972b), photon-weighted PPFD is a better predictor of photosynthesis when light sources with different spectral power distributions are considered. Given this, PPFD is the metric most commonly used by horticulturalists. However, energy-weighted YPFD is useful for energy-balance calculations involving photosynthetic organisms.
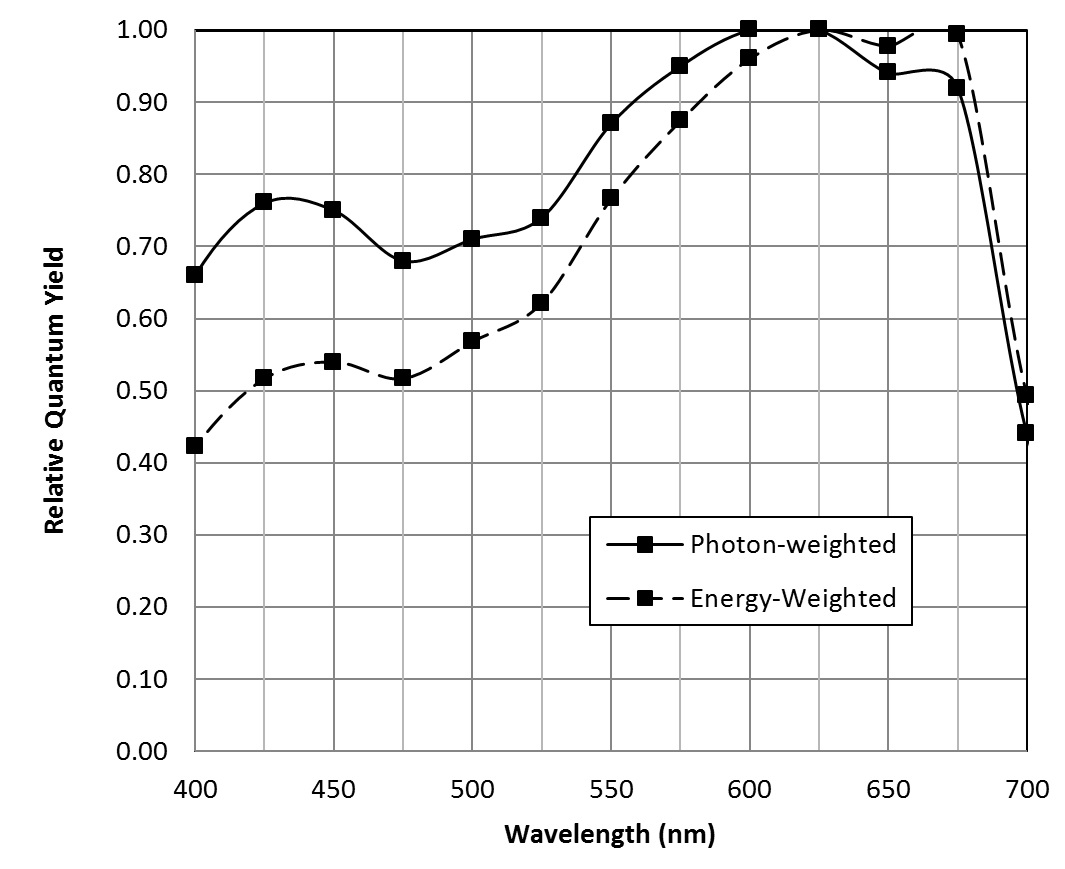
As noted by McCree (1972a), neither PPFD (quantum flux density) nor YPFD (irradiance) are perfect measures of photosynthetically active radiation in that both systematically overestimate the effectiveness of blue light relative to red. As can be seen from FIG. 3, the error is greater for YPFD, which explains why PPFD measurements are preferred by horticulturalists. Nevertheless, they are useful in that they are independent of any particular plant species, and they can be measured both in the laboratory and in the field using a radiometer with a spectrally-calibrated quantum sensor such as the LI-190SA with LI-COR (www.licor.com).
From Lumens to Photosynthetic Photon Flux
As lighting designers, we need some method of converting lumens to quantum flux and illuminance to quantum flux density (PPFD). We can do so however only if we know or can estimate the spectral power distribution (SPD) of the light source.
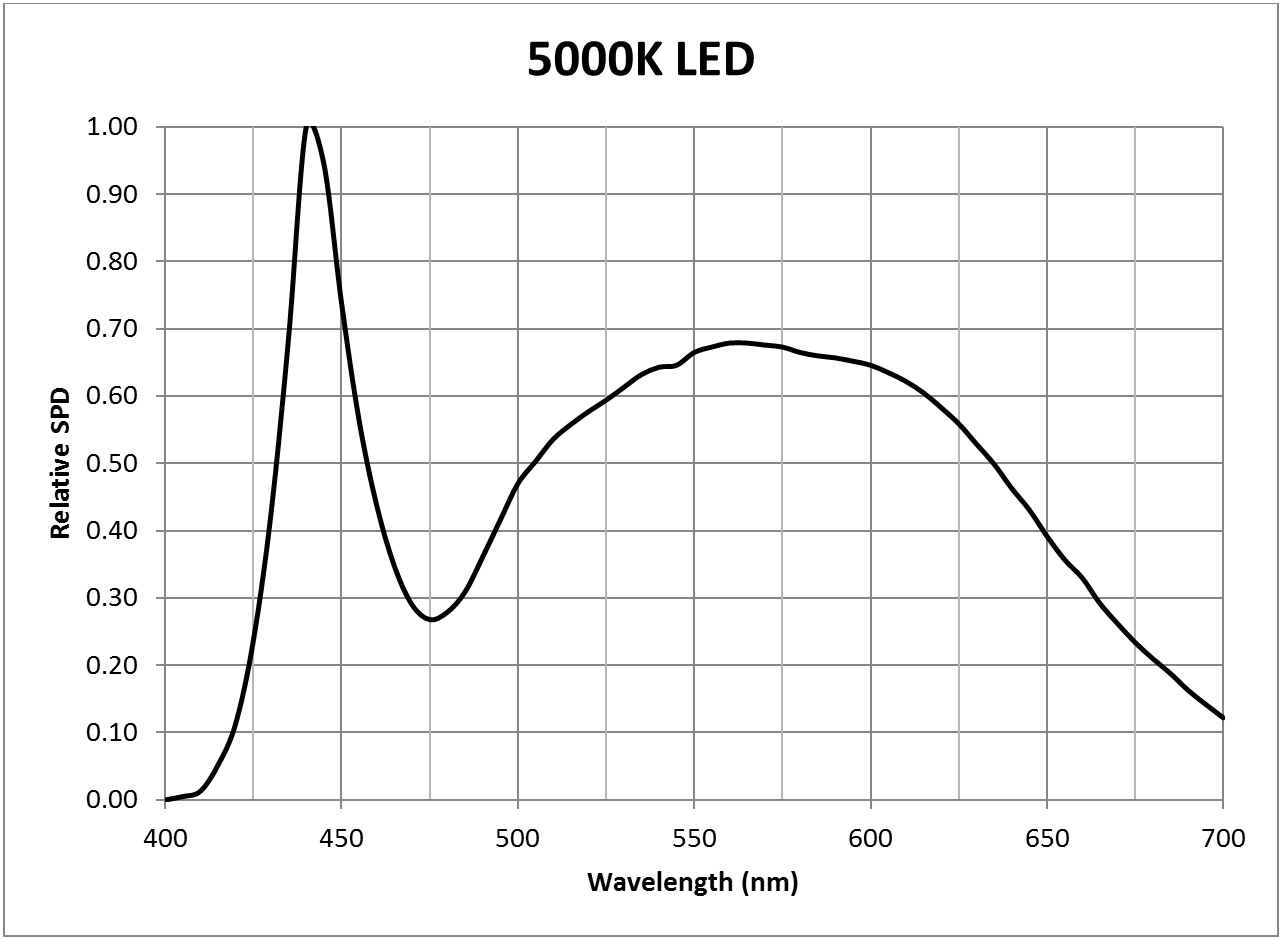
Suppose then that we have a light source with a known relative spectral power distribution (SPD), such as for example a 5000K “cool white” LED (FIG. 4).

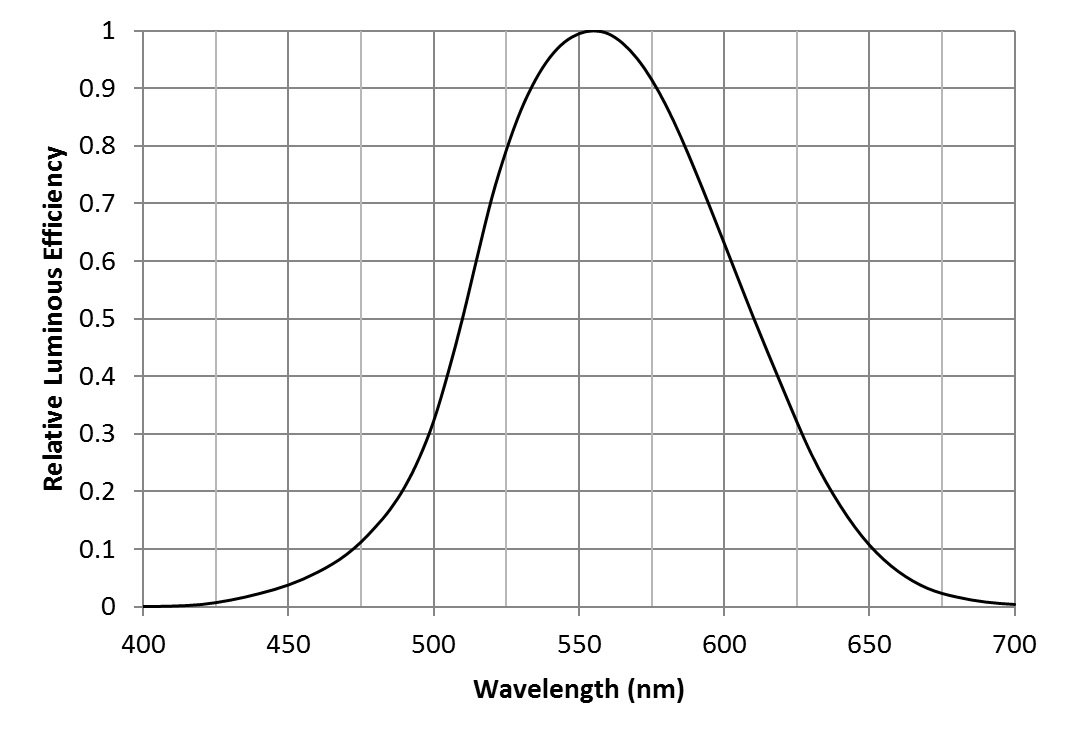
One watt of radiant power at 555 nm is by definition equal to 683 lumens. Given the CIE 1931 luminous efficiency function (FIG. 5), we can calculate the spectral radiant flux Φ(λ) in watts per nanometer for each lumen as:
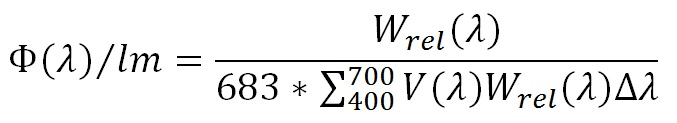
where Wrel(λ) is the relative spectral power distribution, V(λ) is the luminous efficiency function at wavelength λ, and Δλ is the wavelength interval (typically 5 nm). For the above example, the spectral radiant flux per nanometer for each lumen at 440 nm is 22.5 microwatts, while the total radiant flux per lumen is 3.18 milliwatts.
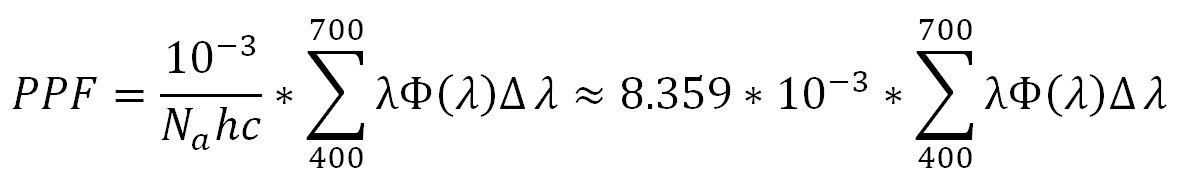
With this, we can calculate the photosynthetic photon flux (PPF) per nanometer in micromoles per second per nanometer:

(where Na is Avogardo’s constant), while summing over the range of 400 nm to 700 nm yields the photosynthetic photon flux (PPF) per lumen for the given light source:
Given an illuminance value (lumens per square meter) and knowing the light source SPD, we can similarly calculate the photosynthetic photon flux density (PPFD) in micromoles per second per square meter (µmol/sec-m2) for the given light source. Again for the above example, one lux is equal to 0.01462 µmol/sec-m2.
Conversion Factors
It is easy enough to find graphical representations of light source spectral power distributions, but it is considerably more difficult to find this information in tabular form suitable for the above calculations. Fortunately, this information is published in CIE 15:4, Colorimetry (CIE 2004). It does not include white light LEDs, but this information can be obtained by digitizing manufacturersí product catalog data (e.g., Philips 2014a).
Given such information, it possible to calculate lux-to-PPFD conversion factors for common light sources:
| Light Source | Conversion Factor |
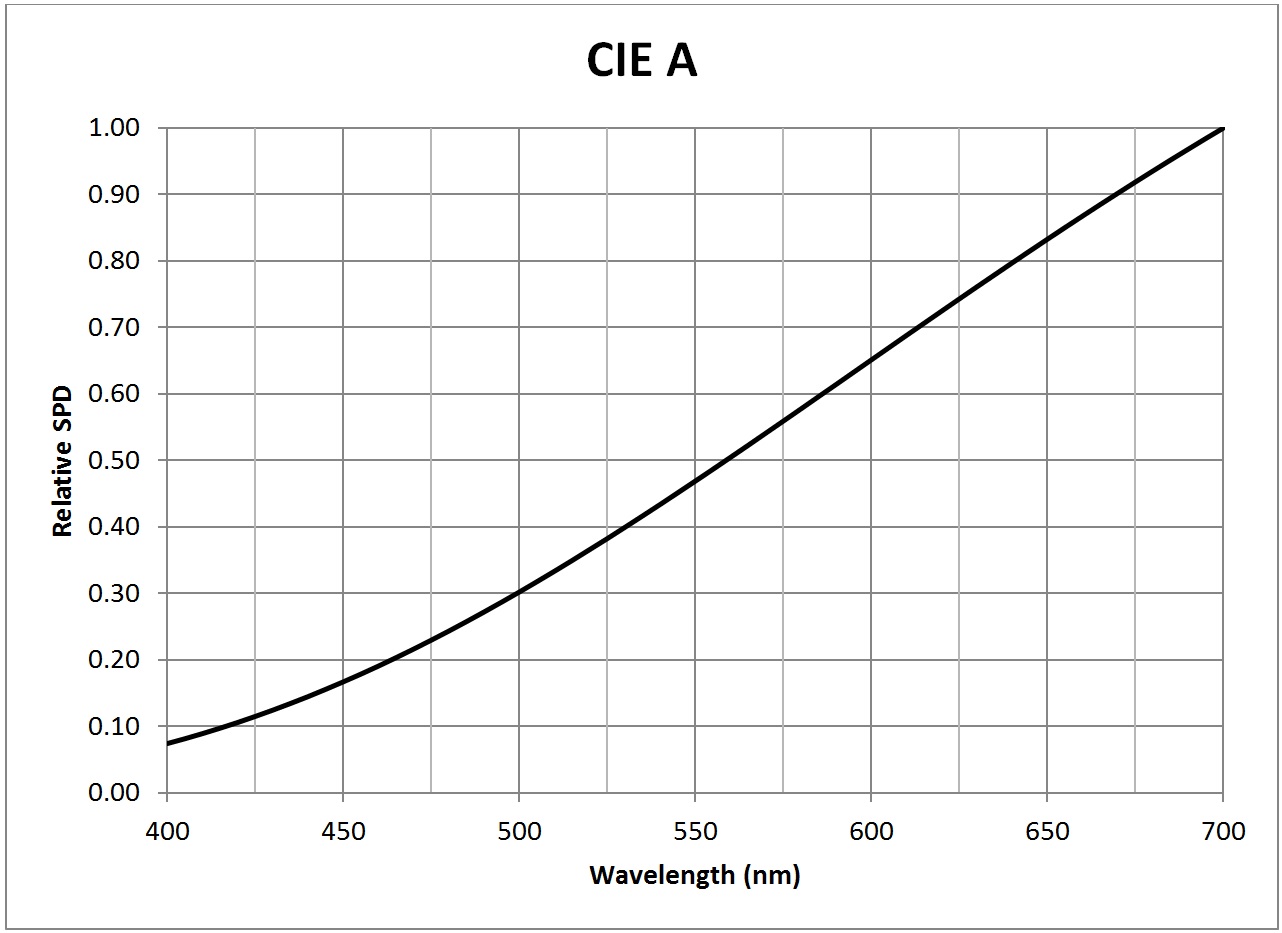
| CIE A (incandescent, 2856K) | 0.0203 |
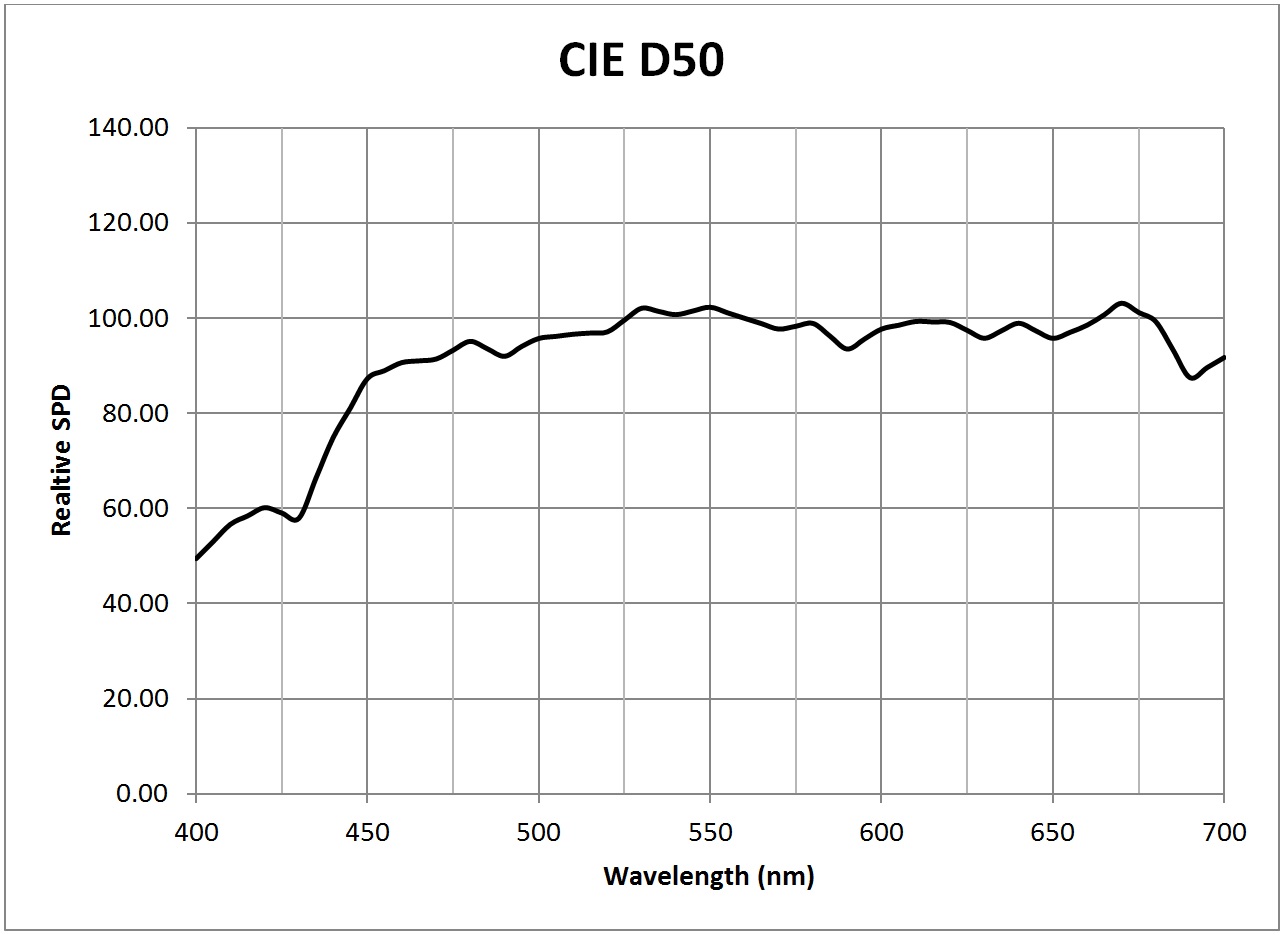
| CIE 5000K daylight (D50) | 0.0181 |
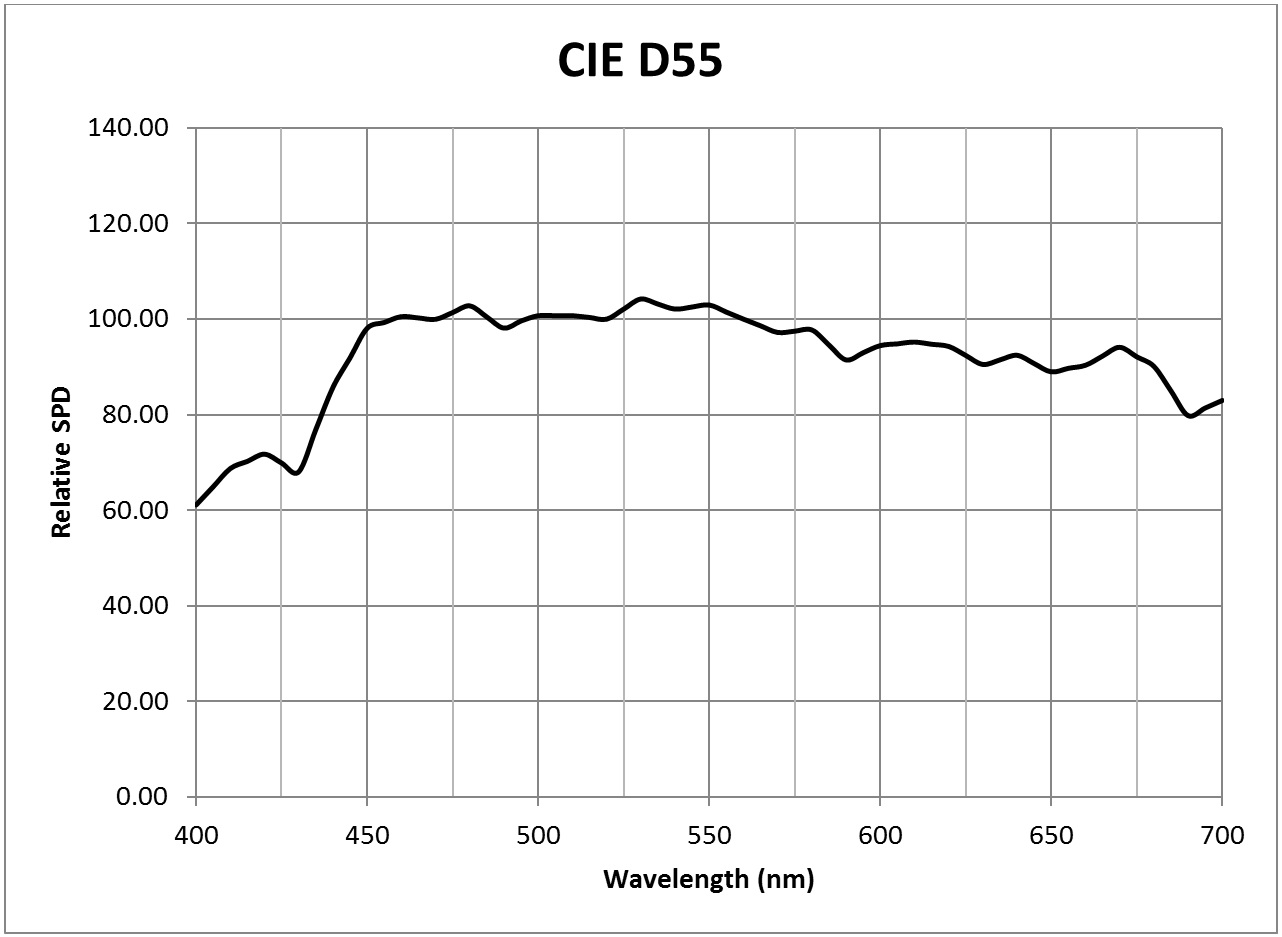
| CIE 5500K daylight (D55) | 0.0181 |
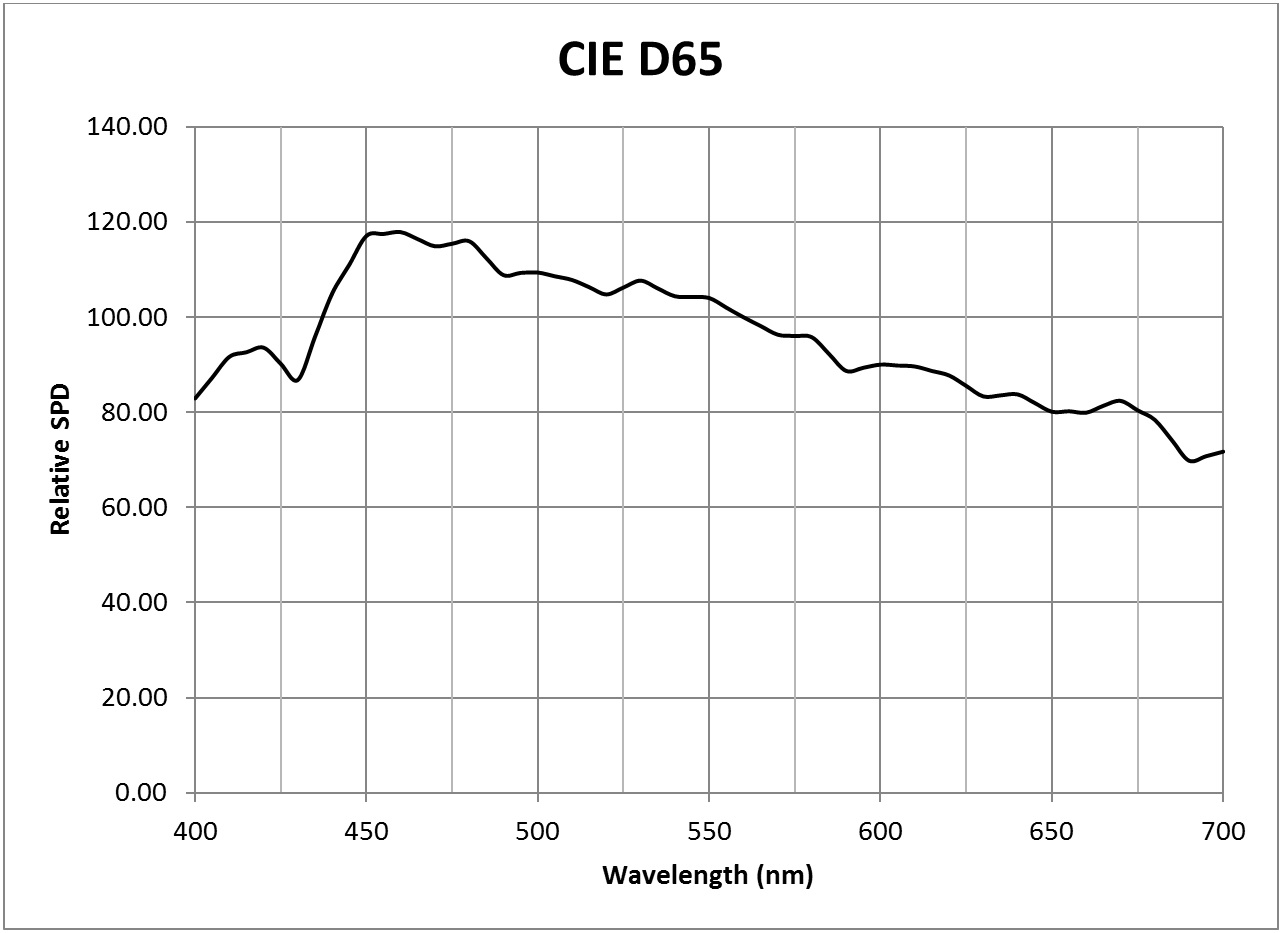
| CIE 6500K daylight (D65) | 0.0183 |
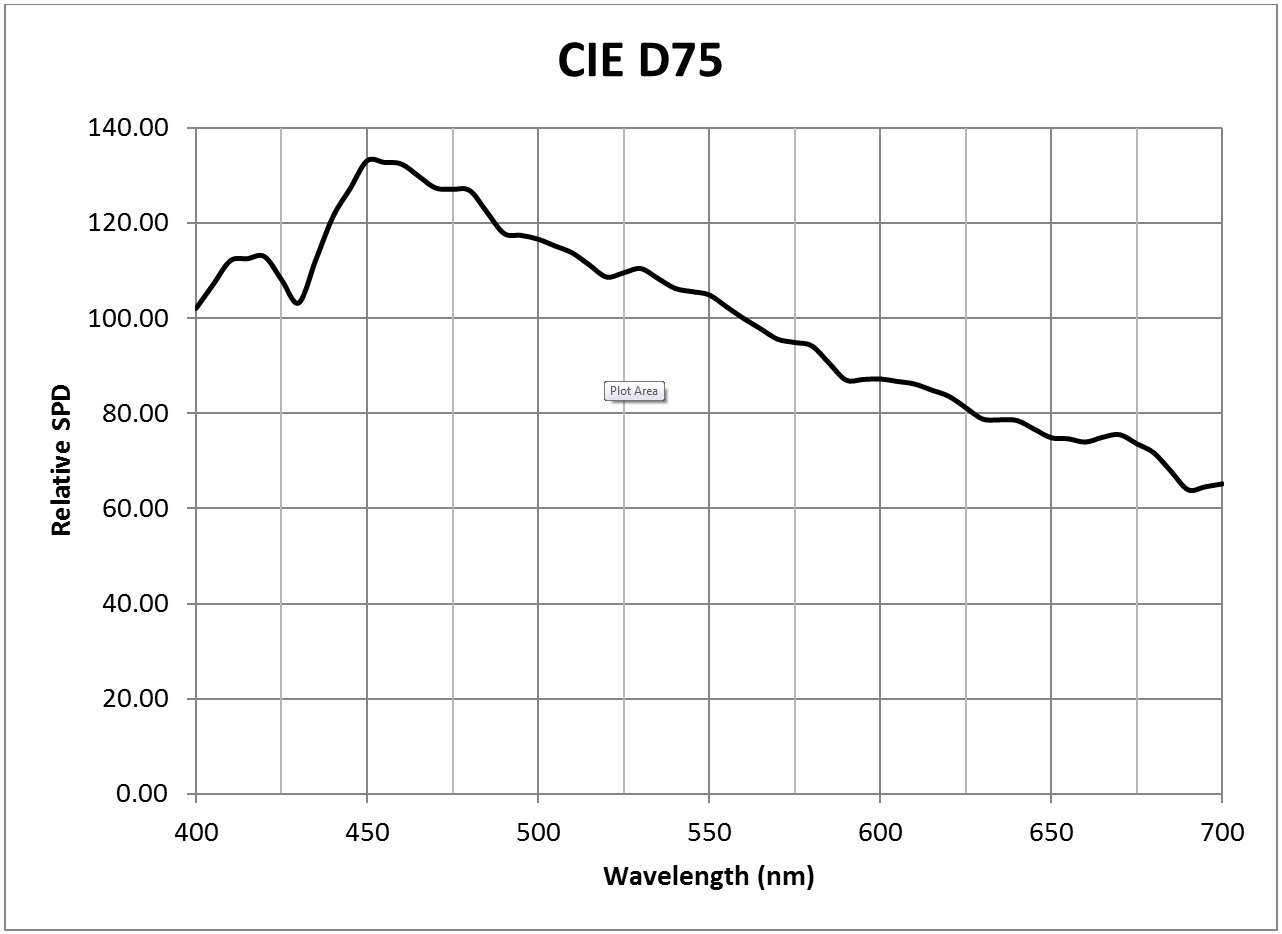
| CIE 7500K daylight (D75) | 0.0186 |
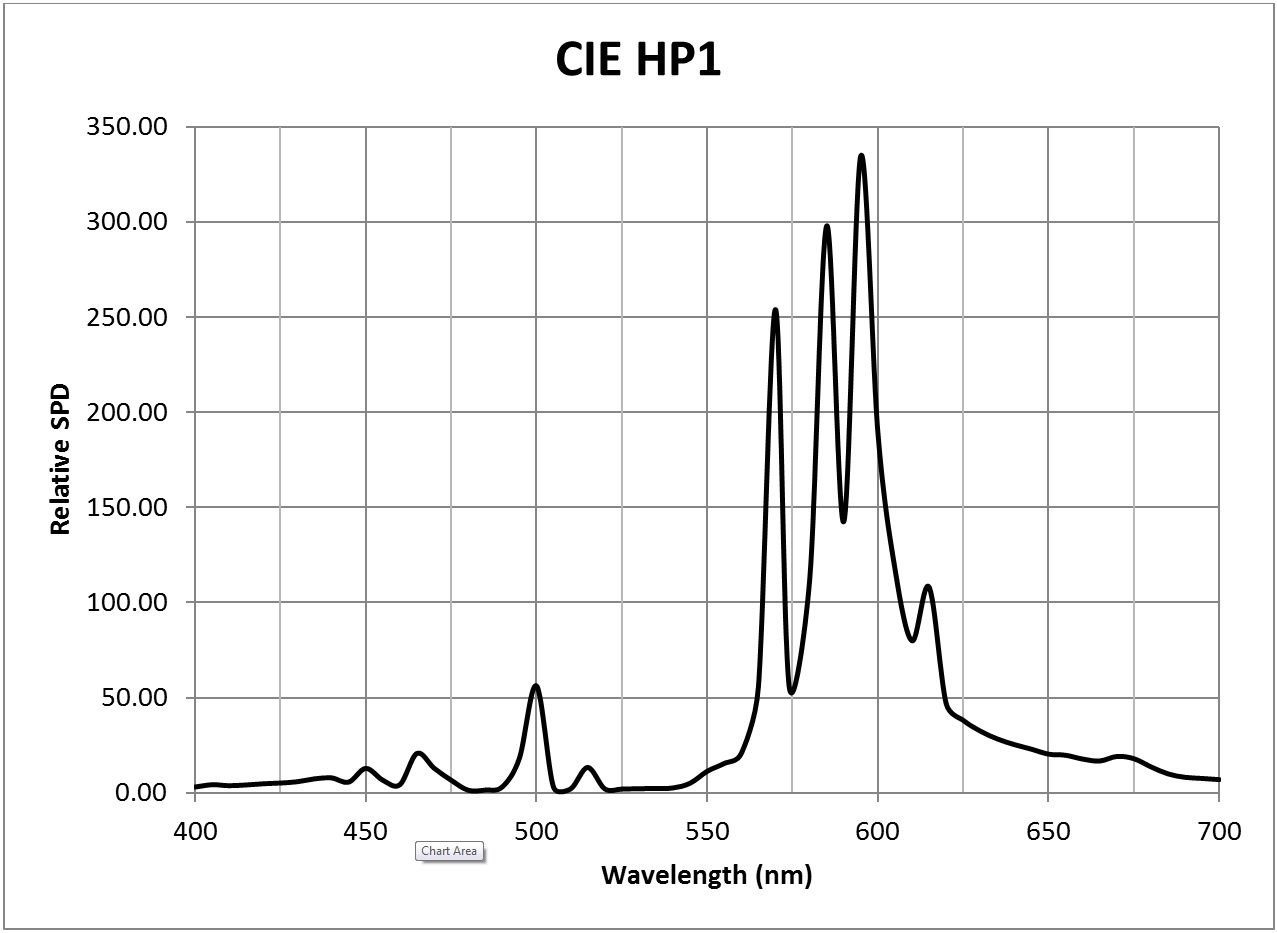
| CIE HP1 (standard high-pressure sodium, 1959K) | 0.0117 |
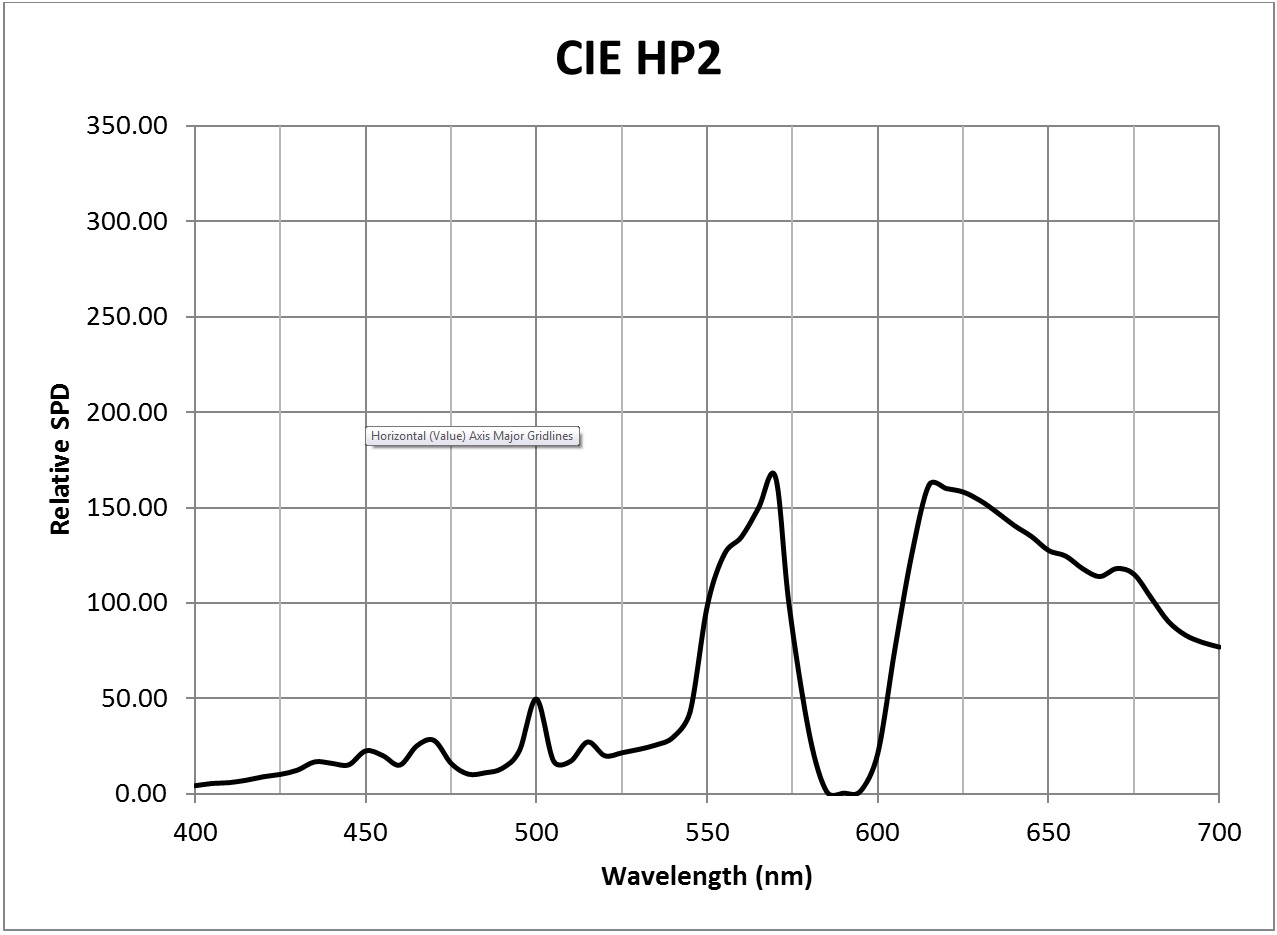
| CIE HP2 (color-enhanced high-pressure sodium, 2506K) | 0.0193 |
| CIE HP3 (high-pressure metal halide, 3144K) | 0.0144 |
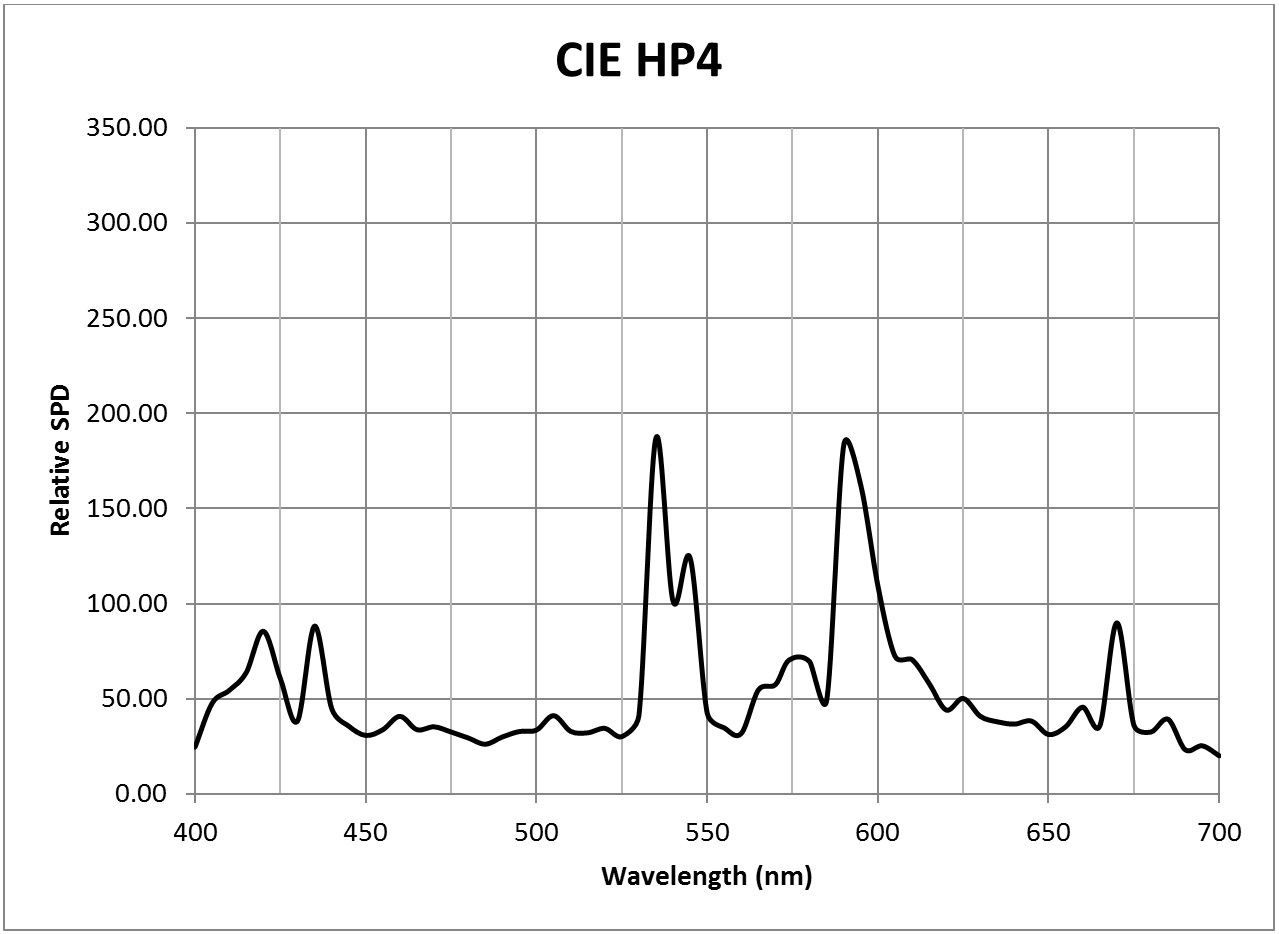
| CIE HP4 (high-pressure metal halide, 4002K) | 0.0150 |
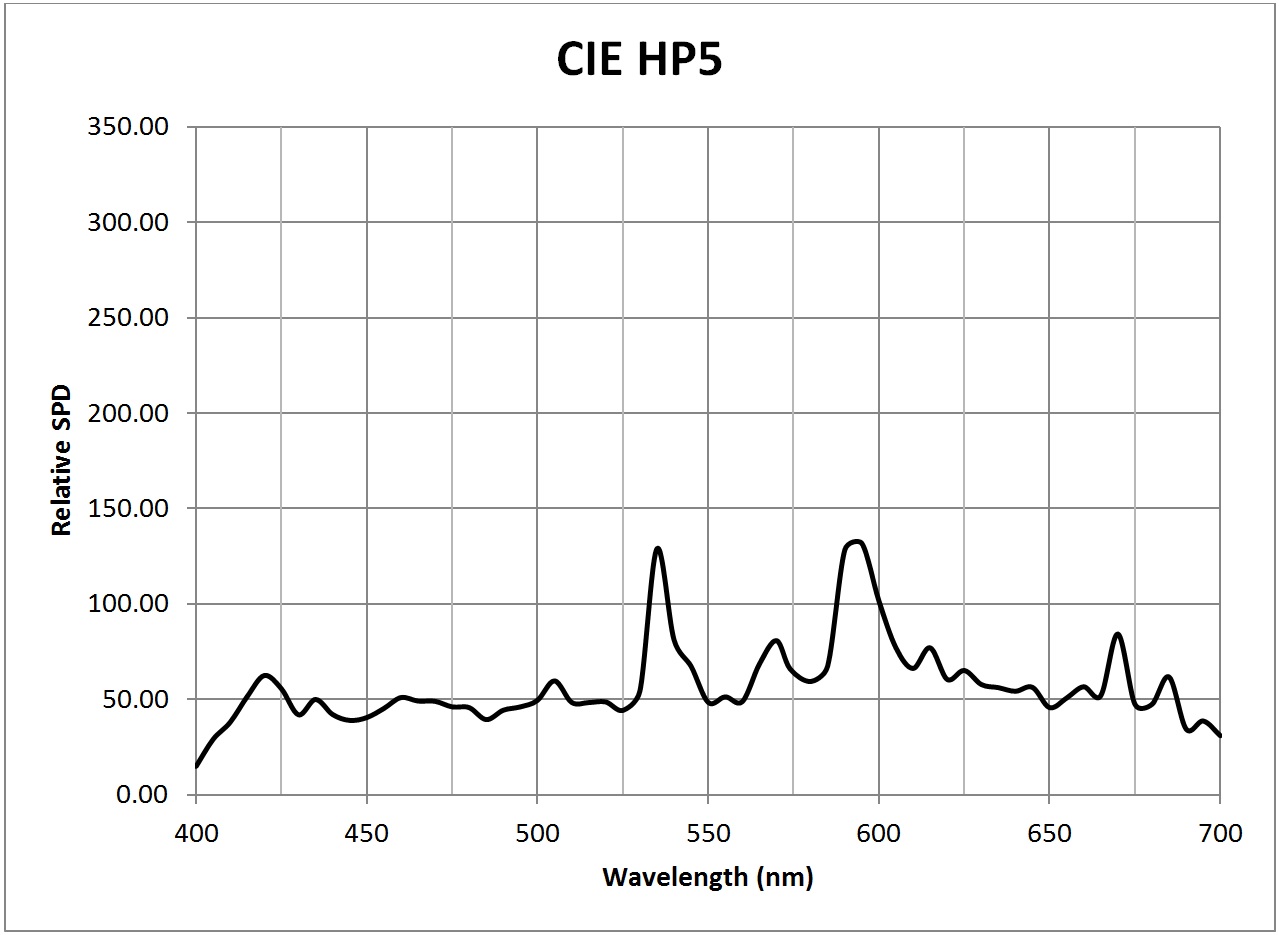
| CIE HP5 (high-pressure metal halide, 4039K) | 0.0163 |
| 2700K white light LED (Philips Luxeon Rebel LXW9-PW27) | 0.0181 |
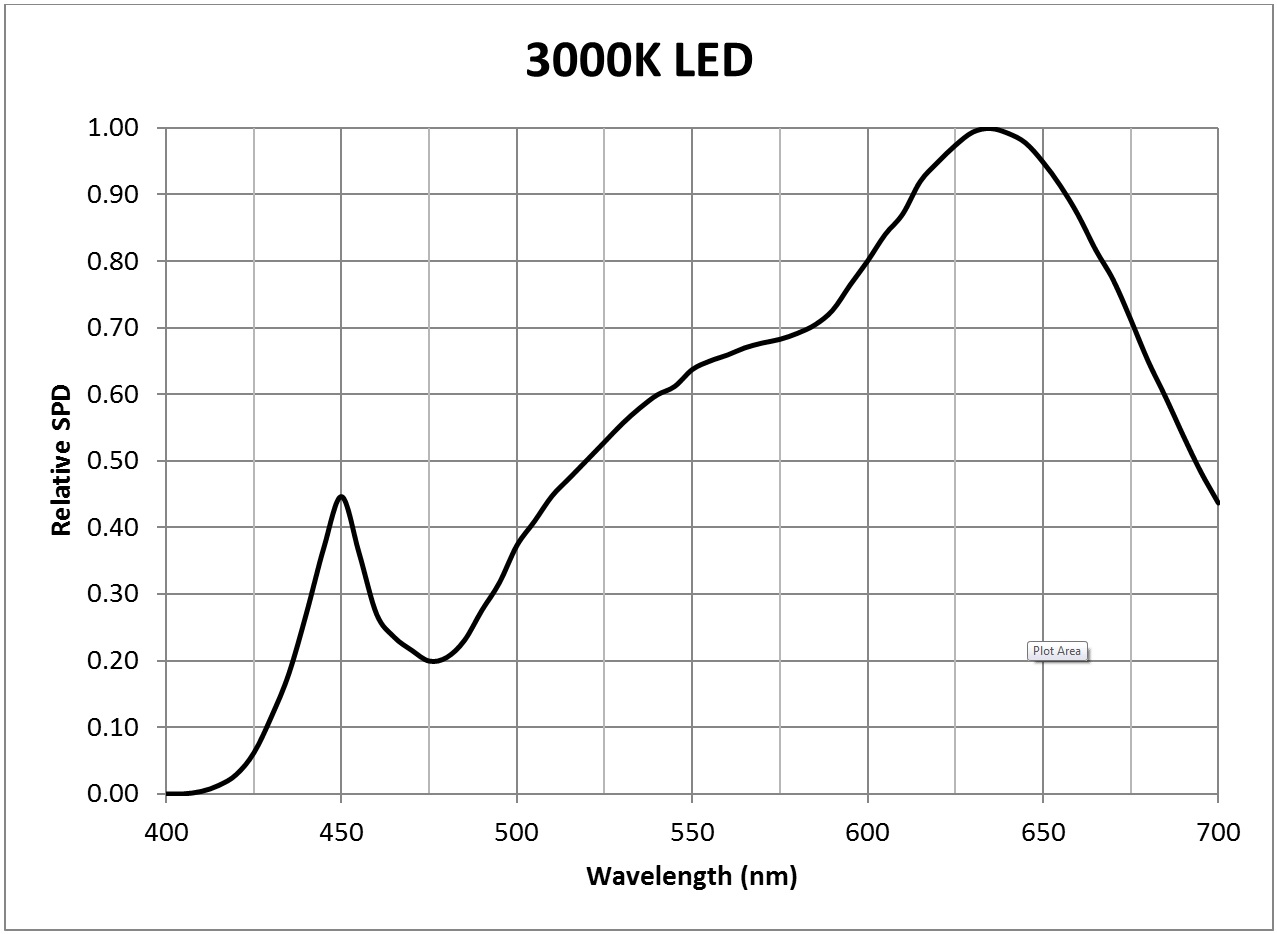
| 3000K white light LED (Philips Luxeon Rebel LXW9-PW30) | 0.0171 |
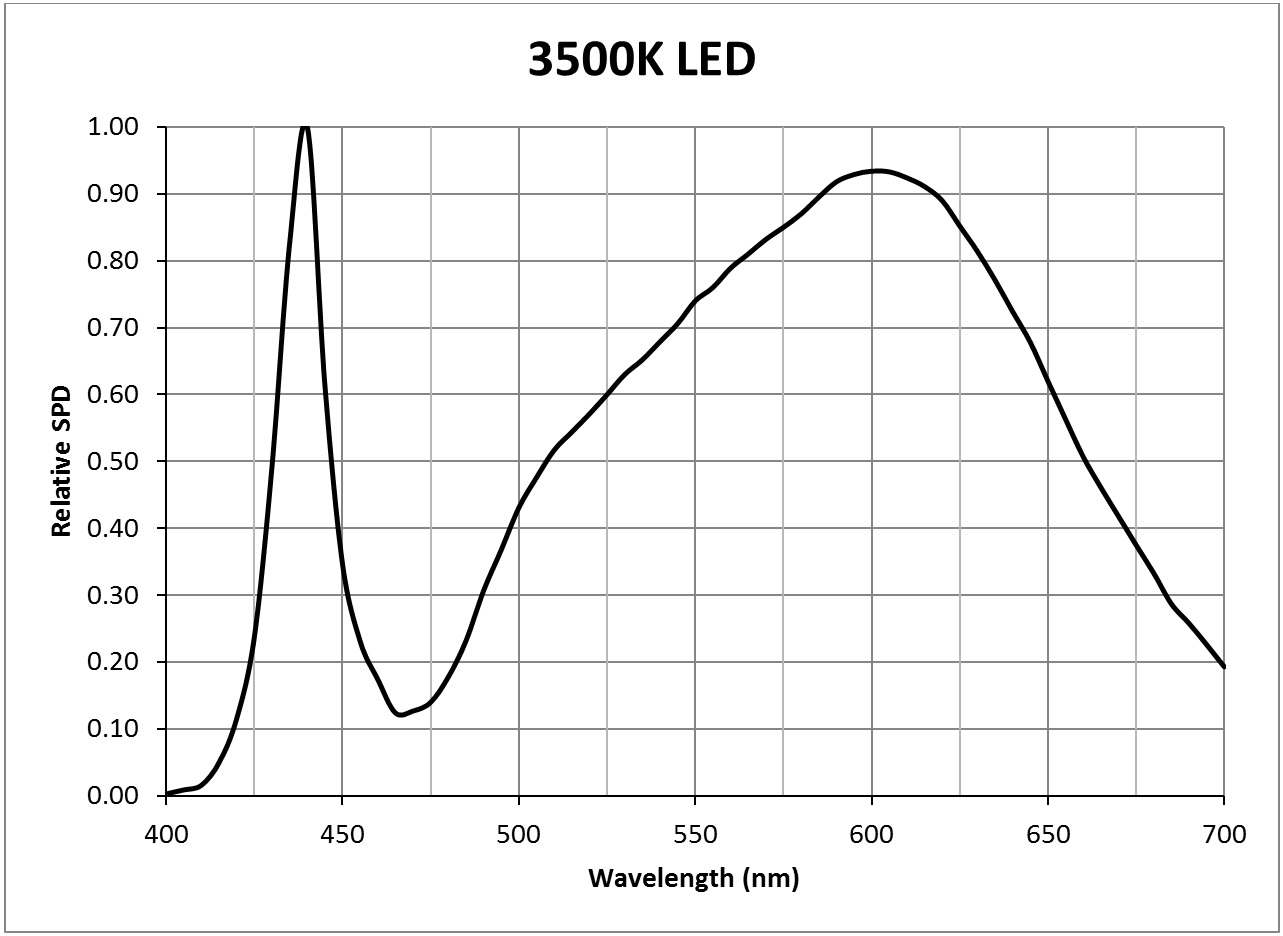
| 3500K white light LED (Philips Luxeon Rebel LXW7-PW35) | 0.0146 |
| 4000K white light LED (Philips Luxeon Rebel LXW8-PW40) | 0.0143 |
| 5000K white light LED (Philips Luxeon Rebel LXW8-PW50) | 0.0146 |
Table 2 – Illuminance (lux) to PPFD (µmol/sec-m2) conversion factors
Table 2 does not include commercial products such as the Sylvania SHP-TS Grolux (with a CCT of 2050K) because Sylvania and most other lamp manufacturers do not publish their lamp SPDs in tabular form. It is possible to digitize the graphical representations of white light LEDs because the bandwidth of the blue “pump” LEDs is at least 15 nm. With high-pressure sodium and metal halide lamps, however, it is impossible to digitize their published SPDs because the wavelength resolution is unknown. A subnanometer-wide line emission, for example, could vary in height by five times, depending on whether the wavelength binning is 1 nm or 5 nm.
Overcast Skies
Table 2 presents conversion factors for the CIE Clear Sky with CCTs ranging from 5000K to 7500K. Their spectral power distributions (shown in the Appendix) were calculated in accordance with the equations published in CIE 15:4, Colorimetry (CIE 2004), which were in turn derived from the spectral distributions of 622 samples of daylight (skylight, and sunlight plus skylight), as discussed in Judd et al. (1964). Considering the variability of daylight, these SPDs are sufficient for most purposes.
What however about overcast skies? To answer this question, we reference “Colors of the Daytime Overcast Sky” by Lee and Hernández-Andréz (2006), who defined “overcast” as meeting two criteria: 1) no clear sky can be visible anywhere; and 2) cloud cover must be sufficiently optically thick that any cast shadows are indistinct.
The authors made over 9,100 spectral irradiance measurements in Granada, Spain, and Annapolis, Maryland on 40 overcast days, including days with drizzle, light rain and snow, with the Sun at least five degrees above the horizon. While the paper offers many interesting details, two items are of particular interest.
First, the correlated color temperature of overcast skies that the authors measured ranged from 5800K to 9300K, with their typical overcast skies having CCTs ranging from 6000K to 6600K. Second, the authors provided SPDs of their two most extreme skies, with CCTs of 5800K and 9300K. These SPDs were used to calculate illuminance (lux) to PPFD (µmol/sec-m2) conversion factors of 0.0178 and 0.0205 respectively. From these values, the CCTs of typical overcast skies can be linearly interpolated to be 0.0182 ± 0.0002. In other words, no different from typical clear skies.
LED Lighting for Horticulture
At this time, high-pressure sodium (HPS) lamps are the most common light source for greenhouse lighting, where it is commonly used to supplement daylight during the winter months. However, with the growing interest in urban horticulture that relies exclusively on electric lighting, light-emitting diodes offer many advantages. This is particularly true for multilayer cultivation, where the close spacing of plants in vertical rack-mounted trays make HPS lighting impractical.
McCree (1972a) noted that the relative quantum yield for crop plant photosynthesis has two peaks at 440 nm and 620 nm. He also noted however, the Emerson effect, which states that photosynthesis in the presence of two or more wavelengths can be more efficient than the sum of that due to the individual wavelengths. In particular, adding white or red light (less than 680 nm) to deep red light (greater than 680 nm) can beneficially increase the rate of photosynthesis.
Green light is also used in photosynthesis, as can be seen from the leaf action spectrum (FIG. 2). It has been established that green light drives photosynthesis more effectively than red or blue light deep within the leaf (Terashima et al. 2009). Further, the insects used in greenhouses as pollinators and biological control agents see best in the green and ultraviolet regions of the spectrum. More interestingly, changes of even 10 nm in the peak wavelength of green light can have dramatic effects on the growth of plants such as lettuce (Johkan et al. 2012).
Plants also exhibit photomorphological responses (i.e., growth and development) to ultraviolet radiation (Zuk-Golaszewska et al. 2003). In the past, this has been mostly of theoretical interest to botanists. Now however with the rapid commercialization of ultraviolet LEDs (Shih 2015) with wavelengths covering the plant biologically-active spectrum of 280 nm to 400 nm, UV-A and UV-B LEDs will likely also find application in horticultural lighting.
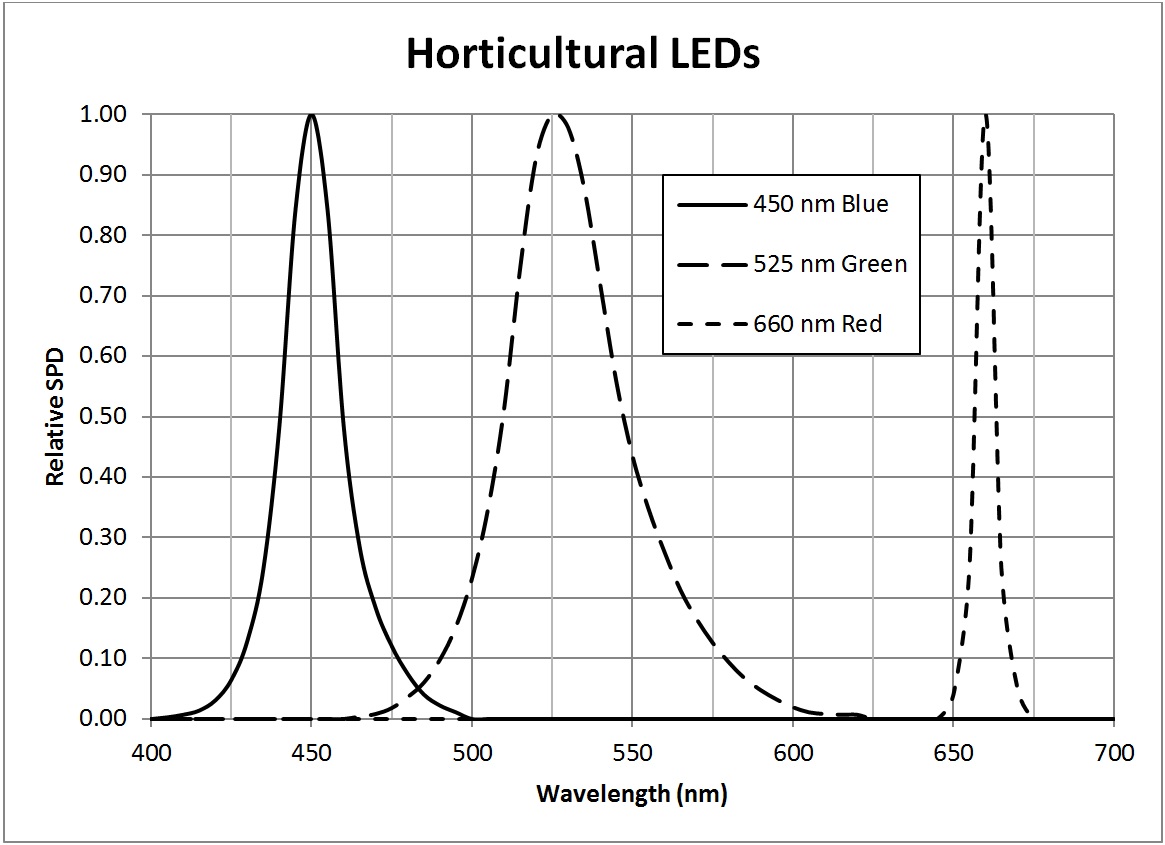
It is likely for this reason that many horticultural LED modules feature efficient 450 nm indium-gallium-nitride (InGaN) deep blue LEDs and 660 nm aluminum-indium-gallium phosphide (AlInGaP) deep red LEDs. Typical examples of these LEDs are the Philips Luxeon Royal Blue (LXML-PRO1-0425) and Deep Red (LXM3-PD01) products (Philips 2014b). Both of these products are quite efficacious, converting some 45% of their electrical input power into visible light. Green LEDs, while beneficial, are rarely used because of their much lower radiant efficacies. (This may soon change, however, as OSRAM Opto recently announced the development of 530 nm InGaN green LEDs with 25% external quantum efficiency.)
Herein however lies a problem: 450 nm and 660 nm are close to the limits of our color vision (see FIG. 4). Consequently, Philips and other manufacturers typically express the optical performance of these products in radiometric rather than photometric terms — milliwatts instead of lumens.
So, the lighting design process becomes a bit more complicated. We first need to digitize the published LED spectral power distributions to determine the conversion factors between milliwatts and lumens — these will be needed for the lighting design simulations. These are given by:
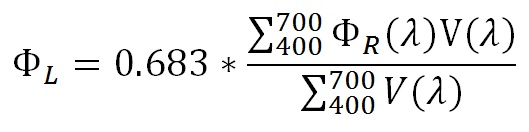
where ΦL is the luminous flux, ΦR(λ) is the relative spectral radiant flux and V(λ) is the luminous efficiency function at wavelength λ.
Using the Philips Luxeon Royal Blue and Deep Red products as an example, the respective conversion factors are approximately 0.07 and 0.03 lumens per milliwatt (lm/mW). However, these figures must be approached with some caution, as they apply to 450 nm and 660 LEDs only. If for example the peak wavelength of deep blue LED was 440 nm rather than 450 nm, the conversion factor would be 0.05 lm/mW. Similarly, if the peak wavelength of the deep red LED was 650 nm rather than 660 nm, the conversion factor would be 0.06 lm/mW. The Philips LED binning ranges are 440 to 460 nm and 650 to 670 nm respectively, which equates to (from FIG. 4) conversion factor uncertainties of +75%, -50% for blue and +60%, -30% for red. The above conversion factors are therefore decidedly approximate.
(Some horticultural LED module manufacturers bin their LEDs more tightly, as peak maxima shifts as small as 10 nm have been shown to have dramatic effects on plant growth. Unless however the binning policy is stated in the manufacturer’s product literature, this cannot be assumed.)
A further word of caution: even the best illuminance meters can be wildly inaccurate when measuring deep blue and deep red light levels. Commercially available photometers are usually classified according to their f1’ number (with f1’ < 3% being preferred), which is basically a measure of how closely the spectral response of the meter matches that of the photopic visual efficiency function (FIG. 4). As noted in CIE 127:2007, Measurement of LEDs (CIE 2007), this is useful for white light measurements only. To quote, “In the case of single-color LEDs, the spectral mismatch errors can be very large even if f1’ is reasonably small, due to the fact that some LED spectra are peaking in the wings of the V(λ) function where the deviation makes little effects on f1’ but can cause large errors.”
With these conversion factors in hand, we can now calculate the illuminance-to-PPFD conversion factors for horticultural LEDs:
| Light Source | Conversion Factor |
| 450 nm deep blue LED | 0.01194 |
| 525 nm green LED | 0.00084 |
| 660 nm deep red LED | 0.01305 |
Table 3 – Illuminance (lux) to PPFD (µmol/sec-m2) conversion factors
How horticulturalists choose to balance the ratio of red to blue light will likely depend on the specific plant species being cultivated and their stage of growth. Some plants like shade, while others prefer direct sunlight, with different SPD requirements. In addition, far-red 735 nm LEDs may be employed to induce flowering. Regardless, the above conversion factors will still be useful.
In addition to using chlorophylls and carotenoids for photosynthesis, plants use these and other photopigments for a wide variety of functions. The phytochromes Pr and Pfr, for example, respond to 660 nm red and 735 nm infrared radiation respectively, and in doing so induce seed germination and flowering, regulate leaf expansion and stem elongation, and trigger photoperiod and shade avoidance responses (see Appendix A).
Other photopigments regulate phototropism (leaf and stem orientation) and circadian rhythms (for which blue light is the most effective), photomorphogenesis (plant shape), root growth, stomatal opening, chloroplast movement … the list goes on, as horticultural researchers continue to explore the role between lamp SPDs and optimal plant health and growth. (See www.photobiology.info for an informative summary of plant photobiology.)
Summary
As a reminder, photosynthetically active radiation (PAR) does not consider the spectral response of plants (FIG. 3); it simply represents the number of photons (quanta) per unit area per second within the range of 400 to 700 nm. With the availability of color-tunable LED modules for greenhouse lighting, horticulturalists will likely want to experiment with different SPDs for specific crops and flowering plants, as well as both the directionality and daily timing (photoperiods) of the luminaires. Regardless, being able to convert predicted and measured illuminance values to PPFD values for common light sources will certainly ease the communication problem between lighting designers and horticulturalists.
Acknowledgements
Thanks to Tessa Pocock of the Smart Lighting Engineering Research Center, Rensselaer Polytechnic Institute, for her review and comments on this article.
Appendix A – Photosynthesis and Visible Light
For illumination engineers, it might seem suspicious that the photosynthetically active radiation is defined over the spectral range 400 nm to 700 nm — exactly the range we commonly assume for human vision. What about longer and shorter wavelengths?
When McCree [4] measured his 22 crop species both in the field and in laboratory growth chambers, he obtained the following action spectra:

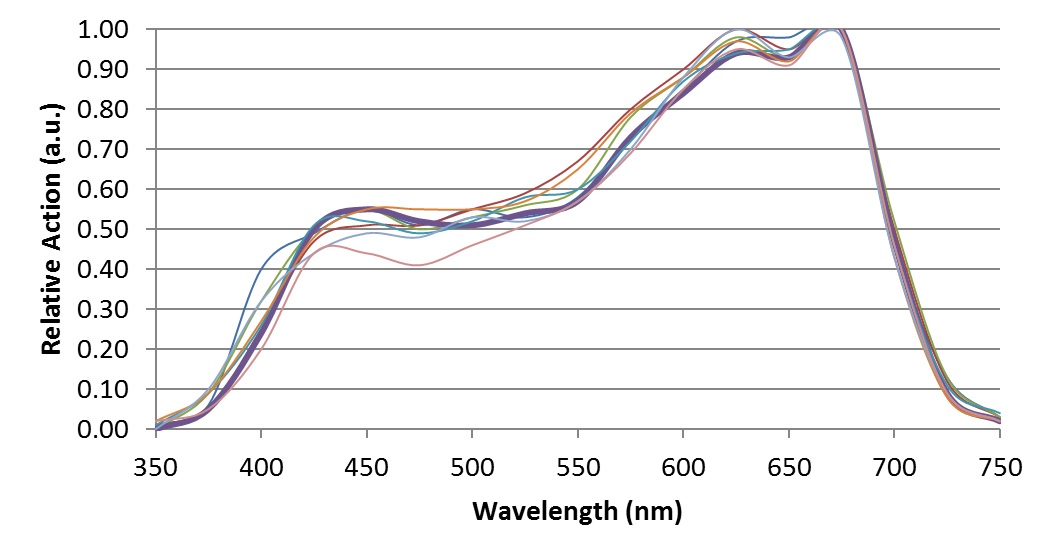
which clearly explain the logic of the 400 – 700 nm spectral range.
Below 400 nm, there is the risk of photooxidation that generates toxic radicals, which can destroy the cellís chlorophyll and other cellular components. Under intense UV radiation, violaxanthin (which is involved in photosynthesis) is converted via the xanthophyll cycle into zeaxanthin. In doing so, it receives excess energy from chlolorphyll and releases it as heat. This process thereby offers the plant photoprotection.
At the same time, other plant photopigments, including cryptochromes and phototropins, do have sensitivities (as measured in vitro) that extend into the ultraviolet, and likely respond under dim light conditions. However, these are likely suppressed under high light conditions by the xanthophyll process.
Above 700 nm, the photon energy is too low to activate the photosynthetic process via the chlorophylls and various cartenoids. However, the phytochrome photopigment, which is responsible for stem elongation, leaf expansion, shade avoidance, neighbor perception, seed germination, and flower induction, has two isoforms called Pr and Pfr. In its ground state Pr, phytochrome has a spectral absorbance peak of 660 nm. When it absorbs a red photon, it converts to its Pfr state, which has a spectral absorbance peak of 730 nm. When the phytochrome molecule absorbs a far-red photon, it converts back to its Pr state, and in doing so triggers a physiological change in the plant.
Chlorophyllous leaves are transparent to infrared radiation, are so the phytochrome signaling mechanism is ideal for sensing the lighting environment on forest floors and in the presence of neighboring plants competing for available direct sunlight.
Appendix B – Light Source SPDs


References
Barnes, C., T. Tibbitts, J. Sager, G. Deitzer, D. Bubenheim, G. Koerner, and B. Bugbee. 1993. “Accuracy of Quantum Sensors Measuring Yield Photon Flux and Photosynthetic Photon Flux,” Horticultural Science 28(122):1197-1200.
Biggs, W. W., A. R. Edison, Jerry D. Eastin, K. W. Brown, J. W. Maranville, and M. D. Clegg 1971. “Photosynthesis Light Sensor and Meter,” Ecology 52:125ñ131.
CIE. 2004. Colorimetry, Third Edition. CIE Technical Report 15:2004. Vienna, Austria: Commission Internationale de l’Eclairage.
CIE. 2007. Measurement of LEDs, Second Edition. CIE Technical Report 127:2007. Vienna, Austria: Commission Internationale de l’Eclairage.
Johkan, M, K. Shoji, F. Goto, S. Hahida, and T. Yoshihara. 2012. “Effect of Green Light Wavelength and Intensity on Photomorphogenesis and Photosynthesis in Lactuca sativa,” Environmental and Experimental Botany 75:128-133.
Judd., D. B., D. L. MacAdam, and G. Wyszecki. 1964. “Spectral Distribution of Typical Daylight as a Function of Correlated Color Temperature,” Journal of the Optical Society of America 54(8):1031-1039.
Lee, R. L., and J. Hernández-Andrés. 2006. “Colors of the Daytime Overcast Sky,” Applied Optics 44(27):5712-5722
Massa, G. D., H.-H. Kim, R. M. Wheeler, and C. A. Mitchell. 2008. “Plant Productivity in Response to LED Lighting,” Horticultural Science 43(7):1951-1956.
McCree, K. J. 1972a. “The Action Spectrum, Absorptance and Quantum Yield of Photosynthesis in Crop Plants,” Agricultural and Forest Meteorology 9:191-216.
McCree, K. J. 1972b. “Tests of Current Definitions of Photosynthetically Active Radiation Against Leaf Photosynthesis Data,” Agricultural and Forest Meteorology 10:443-453.
Mitchell, C. A., A.-J. Both, C. M. Bourget, J. F. Burr, C. Kubota, R. G. Lopez, R. C. Morrow, and E. S. Runkle. 2012. “LEDs: The Future of Greenhouse Lighting!” Chronica Horticulturae 52(1):6-11.
Nelson, J. A., and B. Bugbee. 2014. “Economic Analysis of Greenhouse Lighting: Light Emitting Diodes vs. High Intensity Discharge Fixtures,” PLOS One 9(6).
Philips Lumileds. 2014a. Luxeon Rebel ES Portfolio Datasheet DS61. Philips Lumileds Lighting Company.
Philips Lumileds. 2014b. Luxeon Rebel Color Portfolio Datasheet DS68. Philips Lumileds Lighting Company.
Shih, M. 2015. “Emerging Applications for UV LEDs Drive Broad Interest,” LEDs Magazine 58(11/12):19-22 (Nov/Dec).
Terashima, I., T. Fujita, T. Inoue, W. S. Chow, and R. Oguchi. 1009. “Green Light Drives Leaf Photosynthesis More Efficiently than Red Light in Strong White Light: Revisiting the Enigmatic Question of Why Leaves are Green,” Plant & Cell Physiology 50(4):684-697.
Thimijan, R. W., and R. D. Heins. 1983. “Photometric, Radiometric, and Quantum Light Units of Measure: A Review of Procedures for Interconversion,” Horticultural Science 18(6):818-822.
Zhu, X.-G., S. P. Long, and D. R. Ort. 2010. “Improving Photosynthetic Efficiency for Greater Yield,” Annual Review of Plant Biology 61:235-261.
Zuk-Golaszewska, K., M. K. Upadhyaya, and J. Golaszewski. 2003. “The Effect of UV-B radiation on Plant Growth and Development,” Plant Soil Environ 49:135-140.
[1] A mole is a unit of measurement used in chemistry to express the number of elementary entities in a substance that is equal to the number of atoms in 12 grams of the isotope carbon-12. It corresponds to the Avogadro constant, whose value Na is 6.022 x 10²³ particles (in this case photons) per mole. A micromole is one millionth of a mole. (A micromole [µmol] of photons was sometimes referred to by plant scientists as a microeinstein. However, this unit of measurement is not part of the International System of Units (SI), and so its use has been deprecated.)
[2] The quantum yield in photosynthesis is defined as the micromoles of carbon dioxide fixed per micromole of photons absorbed.