Ian Ashdown, P. Eng., FIES, Senior Scientist, SunTracker Technologies Ltd.
Published: 2013/10/08
If you are involved with outdoor area or roadway lighting design, you will undoubtedly encounter such terms as mesopic multipliers, scotopic lumens, and S/P ratios, and you will sooner or later need to consider mesopic photometry in your design efforts. For example, you may encounter a government specification that states, “Luminaires must have a minimum S/P ratio of x.” What does this mean and, equally important, where can you find this information?
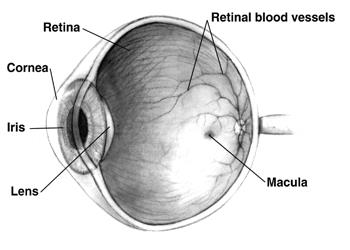
It begins with the human eye:

where light entering the eye through the cornea is focused on the retina. The retina consists of approximately six million cones located mostly at the center of the retina, surrounded by some 120 million rods. The cones, which are responsible for our color vision, function best in bright light, while the color-blind rods are responsible for our night vision.
For scenes with an average luminance above approximately 5.0 cd/m2, photopic vision dominates. The cones have an average spectral response that is described by the photopic luminous efficiency function V(λ) with peak responsivity at 555 nm (Fig. 2). Below approximately 0.005 cd/m2, scotopic vision dominates, with the rods having a spectral response that is described by the scotopic luminous efficiency function V'(λ) with peak responsivity at 507 nm (Fig. 2).

Mesopic vision occurs when the average scene luminance is between approximately 0.005 and 5.0 cd/m2, as both the rods and cones contribute to what we perceive.
We can directly perceive this blending of photopic and scotopic vision due to the Purkinje effect. Cones are more sensitive to red light than are rods. As the light levels dim, red colors appear to darken more quickly than other colors:

This is due to the gradual shift from the photopic to the scotopic luminous efficiency function as the rods begin to predominate.
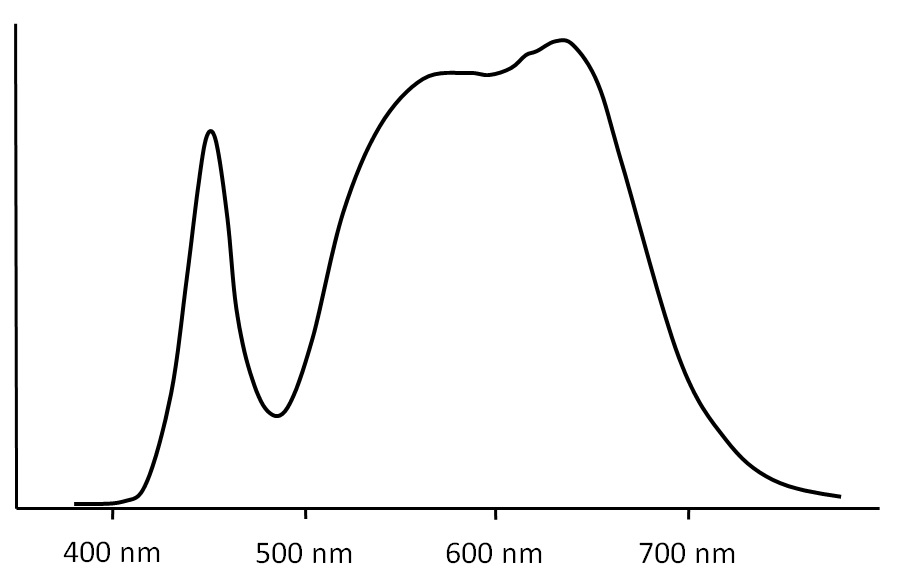
A light source will have a characteristic spectral power distribution (SPD), such as this one for a typical cool white fluorescent lamp:

Calculating the photopic lumens generated by a light source is easy: multiply the SPD by the photopic luminous efficiency function on a per-wavelength basis (typically at 5 nm intervals), sum the results, and scale as required. Calculating the scotopic lumens is the same, only using the scotopic luminous efficiency function.
Herein lies the crucial point: because the photopic and scotopic luminous efficiency functions are different, they will yield different values for the scotopic and photopic lumens. The ratio of these two values is the scotopic-to-photopic (S/P) ratio. In general, light sources with more blue light will have higher S/P ratios. For example:
| Lamp Type | Typical S/P Ratio |
| Low-pressure sodium | 0.2 |
| High-pressure sodium | 0.4 to 0.6 |
| Halogen headlamp | 1.4 |
| Linear fluorescent | 1.3 to 2.3 |
| Metal halide | 1.2 to 2.1 |
| Warm white LED | 1.2 |
| Cool white LED | 2.0 |
Table 1 – Typical S/P ratios
More detailed tables are available (e.g., IES TM-12-12), but the question has to be asked: will the S/P ratio change when the luminaires are relamped?
Some publications on mesopic lighting have indicated that the S/P ratio of a lamp can be estimated from its correlated color temperature (CCT), but this is incorrect except for incandescent lamps (which have little practical application to mesopic lighting). Here for example are two LED modules with the same CCT of 3500 K but very different spectral power distributions and different S/P ratios.

Simply put, the only way to accurately determine the S/P ratio of a light source is through calculation using its spectral power distribution.
Scotopic lumens are important because they better represent how bright objects appear under low light level conditions than do photopic lumens. This leads to the concept of effective luminance factors (ELF). These factors are defined simply as:
ELF = mesopic luminance / photopic luminance
Comprehensive ELF tables are presented in IES TM-12-12 and CIE 191:2010, but they can be summarized as:
| S/P | 0.01 | 0.03 | 0.10 | 0.30 | 1.00 | 3.00 |
| 0.25 | 0.25 | 0.48 | 0.70 | 0.82 | 0.91 | 0.97 |
| 0.50 | 0.50 | 0.69 | 0.81 | 0.88 | 0.94 | 0.98 |
| 0.75 | 0.78 | 0.85 | 0.91 | 0.94 | 0.97 | 0.99 |
| 1.00 | 1.00 | 1.00 | 1.00 | 1.00 | 1.00 | 1.00 |
| 1.25 | 1.18 | 1.12 | 1.08 | 1.05 | 1.02 | 1.00 |
| 1.50 | 1.35 | 1.17 | 1.16 | 1.10 | 1.05 | 1.01 |
| 1.75 | 1.50 | 1.35 | 1.23 | 1.15 | 1.07 | 1.02 |
| 2.00 | 1.65 | 1.46 | 1.30 | 1.19 | 1.10 | 1.02 |
| 2.25 | 1.79 | 1.56 | 1.37 | 1.24 | 1.12 | 1.03 |
| 2.50 | 1.93 | 1.66 | 1.44 | 1.28 | 1.14 | 1.04 |
Table 2 – Effective Luminance Factors (cd/m2)
Table 4.2 of the IES Lighting Handbook somewhat confusingly presents mesopic multipliers, which are intended “to adjust recommended photopic illuminance target values for mesopic adaptation.” They are the inverse of effective luminance factors.
Some caution is needed here in that a government or industry specification may have already taken mesopic lighting into account, in which case the specified minimum luminance has already had a mesopic multiplier applied. This will undoubtedly be the case if the specification also includes a minimum S/P ratio for the light sources. When in doubt, ask.
But now the fun begins — a specification is much more likely to specify a minimum photopic illuminance value, expressed in lumens per square meter (or foot). Now what?
To begin with, mesopic photometry (for lighting applications) assumes that all surfaces being illuminated are: a) grey or pastel-colored; and b) diffuse reflectors. In this case, the luminance L of the illuminated object is given by:
L = ρ * E / π
where ρ is the reflectance of the surface and E is the illuminance. (As a reminder, π is approximately 3.14.)
If the surface is strongly colored, then the spectral power distribution of the reflected light will be very different from the SPD of the light source, and so the S/P ratio will not apply in terms of the surface luminance.
This assumes of course that the surface reflectance is known or can be estimated. For example, the diffuse reflectance of roadway surfaces ranges from approximately 8 percent for bituminous asphalt to 17 percent for concrete (Gillet 2001). Ideally, the target reflectance will be included in the specification.
We must now ask, “What is the meaning of average scene luminance?” The point here is that mesopic photometry depends on the visual adaptation of the viewer to the average scene luminance. Unlike other photometric quantities such as lumens, luminance, luminous intensity, luminous exitance, and illuminance, mesopic quantities are meaningless without a viewer whose state of visual adaptation is known.
As it turns out, the majority of the cones in the retina occupy only the central 2 degrees or so of our visual field of view (called the fovea). It may seem nonsensical, but we perceive color only within a region about the diameter of two thumbnails held at armís length. We may think we perceive color within our entire field of view, but this is only because our brains are filling in the details as we visually scan a scene.
What this means is that our mesopic adaptation is mostly determined by the luminance of the surface we happen to be looking at (Moon 1943). The background surround has very little influence on this adaptation (less than 10 percent). As we shift our gaze towards different objects, our visual adaptation state changes accordingly.
Visual adaptation is not, of course, instantaneous. It is a complex mechanism involving mechanical changes in pupil size, photochemical changes (pigment bleaching in the retina), and neural changes (synaptic interactions). This is likely why the IES Lighting Handbook (Section 4.12.3, “Spectral Effects”) recommends that mesopic photometry not be applied to roadway lighting where the speed limit is greater than 40 kph (25 mph). (This limit may be increased in the future, subject to ongoing roadway vision research.)
In view of the above, IES TM-12-12 defines the mesopic adaptation field as the point on a surface that the viewer is looking at, and then recommends the following calculation procedure:
- Obtain the lamp S/P ratio.
- Determine the target design illuminance Edesign.
- Determine the target reflectance ρ.
- Determine the required design luminance Ldesign = Edesign * ρ / π
- Calculate the photopic illuminance Ephotopic of the target.
- Determine the target photopic luminance Lphotopic = Ephotopic * ρ / π
- Determine the effective luminance multiplier ELF based on S/P and Lphotopic.
- Convert the photopic luminance to the effective (mesopic) luminance Leffective = Lphotopic * ELF
- Reiterate steps 5 to 8 while modifying the design until Leffective equals or exceeds Ldesign.
- If necessary, calculate the effective target illuminance Eeffective = Leffective * π / ρ.
Given this, you would expect that roadway and outdoor area luminaire manufacturers would provide S/P ratios for their products, but to date this has not been the case. Information on lamp S/P ratios can be exceedingly difficult to find. Possible reasons include:
- The S/P ratio is a function of the lamp or lamp module rather than the luminaire. For fluorescent and high-pressure discharge (HID) lamps, the luminaire manufacturer typically has no control over what lamps the contractor or owner may install in the luminaires.
- Most lamp manufacturers do not provide SPDs or S/P ratios for their products. This is difficult to explain, as they can be easily measured by a spectroradiometer by an independent photometric laboratory.
- The SPDs of fluorescent and HID lamps is a function of their proprietary gas fill mixtures and phosphors. If lamp manufacturers were to provide S/P ratios for their products, they might have to change their product numbers if these proprietary formulations were to change.
- The SPDs of white light LEDs are dependent on the dominant wavelength of the blue pump LEDs and the proprietary phosphors and phosphor mixtures used to down-convert the blue light to longer wavelengths. Again, if LED manufacturers were to provide S/P ratios for their products, they might have to change their product numbers if these proprietary designs were to change. (For whatever reason, phosphor manufacturers are equally protective of the detailed SPDs for their products.)
- Many LED lamp module manufacturers purchase their LEDs from third parties, and so have no control over changes to the LEDs apart from specifying minimum luminous flux output and CCT binning.
- Many luminaire manufacturers purchase their LED modules from third parties, which makes it even more difficult for them to guarantee the S/P ratios of their products.
In an ideal world, lighting designers would have unfettered access to the S/P ratios of the luminaires they specify in order to perform mesopic lighting calculations. Unfortunately, this will require changes to the entire supply chain of phosphors, fluorescent and HID lamps, LEDs and LED modules, and luminaires. These changes are possible, but it may take some time for the lighting industry to adapt to the brave new world of mesopic photometry.
References
CIE. 2010. Recommended System for Mesopic Photometry Based on Visual Performance. CIE Technical Report 191:2010. Vienna, Austria: Commission International de l’Eclairage.
Gillet, M., and P. Rombauts. 2001. “Precise Evaluation of Upward Flux from Outdoor Lighting Installations (Applied in the Case of Roadway Lighting),” Proc. International Conference on Light Pollution. Serena, Chile.
IES. 2010. IES Lighting Handbook, Tenth Edition. New York, NY: Illuminating Engineering Society of North America.
IES 2012. Spectral Effects of Lighting on Visual Performance at Mesopic Lighting Levels. IES TM-12-12. New York, NY: Illuminating Engineering Society of North America.
Moon, P., and D. E. Spencer. 1943. “The Specification of Foveal Adaptation,” J. Optical Society of America 33(8):444-456.