Ian Ashdown, P. Eng., FIES, Senior Scientist, SunTracker Technologies Ltd.
Published 18/06/04.
Most LED grow lights feature blue and red LEDs whose peak wavelengths – approximately 450 nm for blue and 660 nm for red – have been chosen to coincide with the spectral absorption peaks of chlorophyll A and B molecules. In doing so, they optimize the conversion of electrical energy into plant photosynthesis.
Some manufacturers, however, are now offering grow lights with “far-red” LEDs that feature peak wavelengths of approximately 735 nm. Unfortunately, they offer little if any information on why these LEDs are useful.
In order to make an informed choice when purchasing these grow lights, it is necessary to understand some of the science behind far-red radiation and how plants perceive and respond to it.
Red and Far-Red Radiation
What we call “visible light” is electromagnetic radiation with wavelengths ranging from 400 to 700 nanometers (nm). We perceive this radiation as ranging from very deep blue (400 nm), bordering on ultraviolet radiation, to very deep red (700 nm), bordering on infrared radiation. Coincidentally, this is also the range of wavelengths that plants can utilize for photosynthesis (PAR = Photosynthetically Active Radiation).
There is no formal definition of “red” in terms of wavelength, but it is often considered to consist of wavelengths ranging from 600 nm (bordering on orange) to 700 nm. The term “far-red,” on the other hand, has been formally defined to consist of wavelengths between 700 nm and 800 nm. We can barely see this radiation as a very deep red if the radiation is intense enough, but it is for practical purposes invisible to the human eye. Plants, on the other hand, readily perceive and respond to far-red radiation.
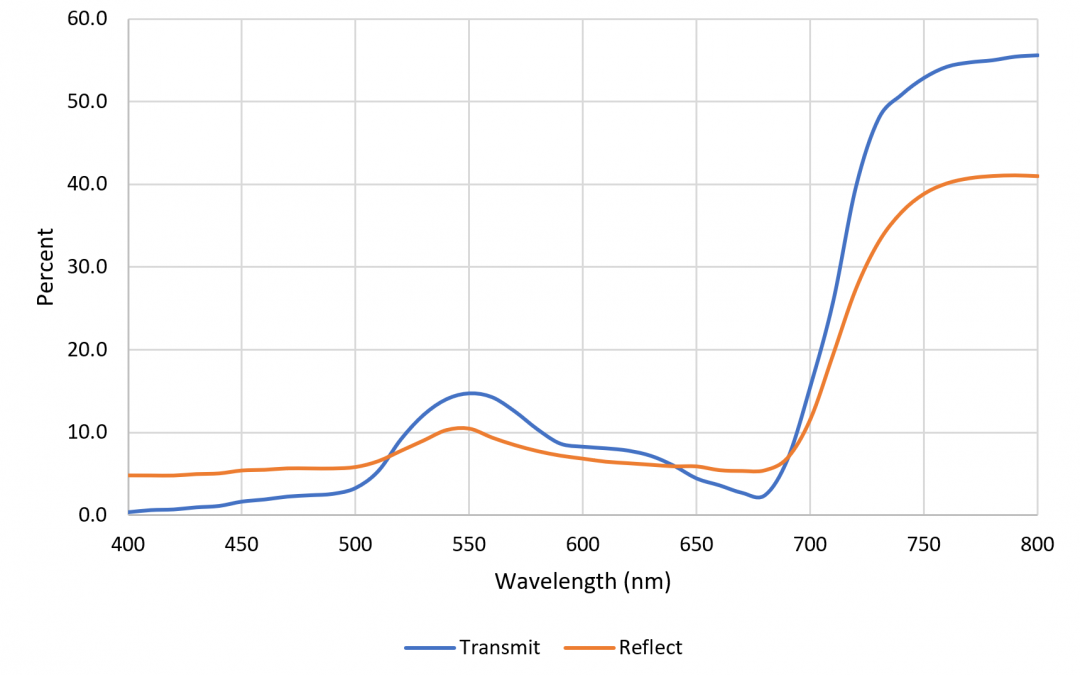
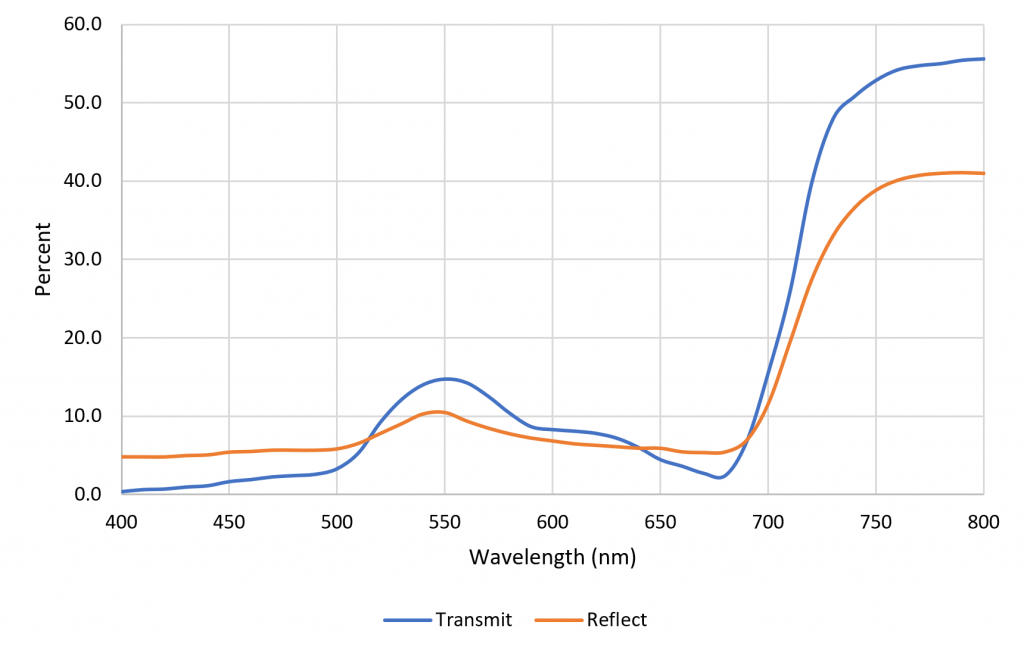
We see vegetation as being green because the chlorophyll A and B molecules strongly absorb blue and red light. A typical green leaf absorbs 90 percent of incident red light; the remainder is reflected and transmitted (FIG. 1). Beyond 700 nm, however, chlorophyll is basically transparent. This means that beyond approximately 750 nm, green vegetation reflects 40 percent and transmits 55 percent of far-red radiation. The region of rapid change in spectral reflectance between 700 and 750 nm is called the “red edge,” and is used to monitor vegetation coverage from space using remote imaging.
FIG. 1 – Typical Vegetation Spectral Properties.
The Phytochromes
Angiosperms – flowering plants – also take advantage of the red edge using a family of photoreceptor molecules called phytochromes (Latin for “plant color”). They have been doing so since they first appeared in the fossil record some 160 million years ago. It is not an exaggeration to say that without these molecules, we would still be living in a world of conifers, cycads, and ginkgoes.
The number of different phytochromes varies by plant species – rice has three, thale cress (Arabidopsis thalania) has five, maize has six, and so on. Each type serves different (and often multiple) functions in each species, but they all absorb red and far-red light in exactly the same manner.
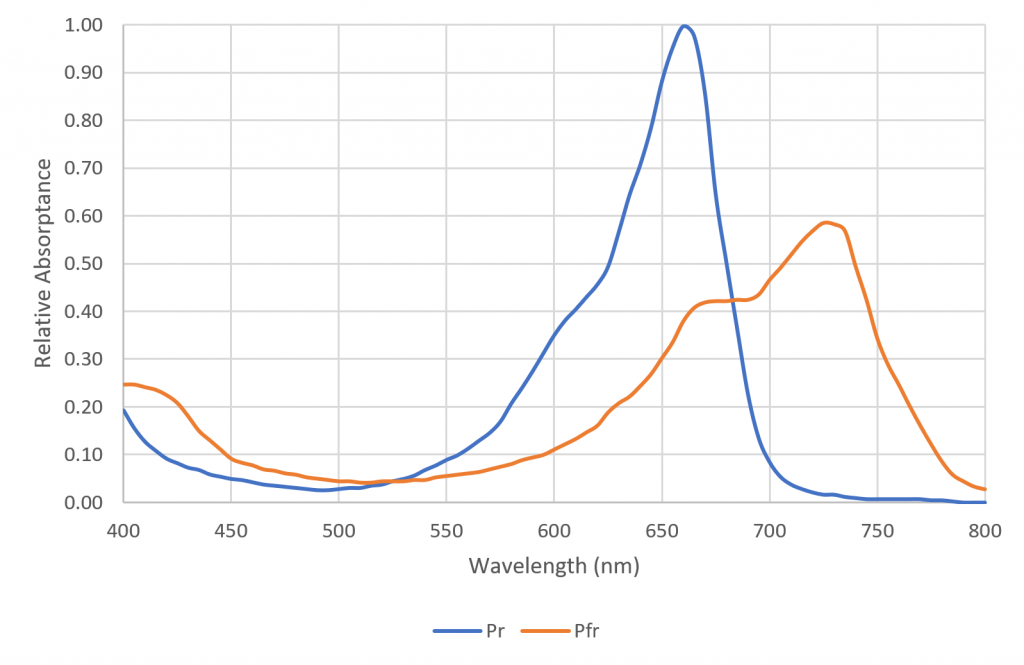
Each phytochrome molecule has two states called isoforms. Left in the dark for several hours, it reverts to a state called Pr, where it strongly absorbs red light (FIG. 2). If a phytochrome molecule in this state absorbs a red photon, it changes to its Pfr state, where it absorbs far-red radiation. If the molecule absorbs a far-red photon, it reverts back to its Pr state. When in its Pfr state, the molecule is biologically active, and may interact with the plant’s molecular machinery. Given this, phytochrome can be seen as a reversible biological switch that can enable or inhibit various plant functions. One such important function is the detection of neighboring plants.
FIG. 2 – Phytochrome Spectral Absorptance.
Shade-Avoidance Syndrome
Flowering plants that tolerate full or partial sun need to gain access for their leaves to direct sunlight in order to photosynthesize. The problem is that they often have competition from other plants for the same resource. That is, the leaves of other plants may block access, either at present or in the future. In response, the plant may elongate its stem (apical dominance) and decrease branching in order to tower above the competition. In doing so, it necessarily diverts resources from other priorities, including producing secondary metabolites for pathogen resistance and insect herbivore deterrence, improving drought tolerance, and reducing root biomass. Together, these responses are called the shade-avoidance syndrome (SAS).
If the plant realizes or predicts that it cannot avoid being shaded, it responds by growing in a more compact form and flowering early. Being crowded by other plants, it is more susceptible to pathogen and herbivore predation. The best strategy is therefore to build chemical and defenses and stay close to the ground while producing seeds as soon as possible in order to survive into the next generation.
Shade-loving flowering plants, on the other hand, may not exhibit any of the SAS responses, at least to the same degree. The daylight they receive has likely been diffused by the forest canopy, and so there is less advantage in devoting resources to avoid being blocked by the leaves of neighboring plants.
Red/Far-Red Ratio
On a clear day, direct sunlight has a ratio of red light to far-red radiation (R:FR) of about 1.3. That is, there is about 30 percent more red light than far-red radiation that is received by the plant leaves. Even daylight reflected from natural inorganic materials such as rock and soil exhibits roughly the same R:FR ratio.
When the direct sunlight is being blocked by the leaves of neighboring plants, however, the “red edge” effect takes hold. A single layer of leaves can change the R:FR ratio from 1.3 to 0.2 or less. That is, there is now about six times less red light than far-red radiation incident on the plant leaves. Two layers of leaves and the difference becomes thirty times or more.
Flowering plants use phytochrome to detect the R:FR ratio and so decide whether SAS responses are necessary. In addition to detecting whether the direct sunlight is being directly blocked, the plants can determine from the R:FR ratio whether there are neighboring plants that might pose a future threat and so initiate appropriate SAS responses.
End of Day
The R:FR ratio of direct sunlight is about 1.3 during most of the day, but it approaches 0.6 or so during twilight when the atmosphere preferentially scatters blue light and the sky turns yellow and red. This only lasts for half an hour or less, but it is important because plants use these changes to synchronize their internal circadian clocks both with the 24-hour day and the seasons. This involves a burst of gene expression activity that is controlled by phytochrome.
Blackout curtains can be used in greenhouses to eliminate twilight, and both red and far-red LEDs can be used to simulate twilight for vertical farms at the end of the daily photoperiod. Interestingly, low PAR values are required, on the order of one µmol·m-2·sec-1, for this purpose. Various SAS responses to red and far-red pulses have been recorded for different species, including stem elongation and changes in leaf area. End-of-day pulses of far-red radiation, for example, have been shown to result in useful hypocotyl elongation of tomato rootstocks for grafting.
Night Breaks
Floriculturists have long used incandescent lighting at night to disrupt the photoperiod of short-day plants such as poinsettias and chrysanthemums. During the night, the phytochrome molecules revert to their biologically inactive Pr state. If the plants are exposed to incandescent lighting (which has an R:FR ratio of 0.7) during the night, the phytochrome molecules are re-activated, which results in their circadian clocks being reset. Repeated nightly exposure (“night breaks”) in the middle of the night prevents the plants from stopping vegetative growth and setting their flower buds.
For long-day plants, night break lighting may have the opposite effect of advancing rather than delaying flowering. The operative here is “may,” as different species and even cultivars respond differently to night breaks.
It is important to note that only red light can be used for night breaks; when phytochrome is in its Pr state, it cannot absorb far-red photons. Red LEDs with their 660 nm peak wavelengths are thus ideal for night break lighting, whereas far-red LEDs will have no effect (FIG. 2).
Far-Red Radiation Sources
Given that plants are subjected to an R:FR ratio of 1.3 in direct sunlight and much lower ratios when shaded by neighbouring plants, it is interesting to consider what we subject them to with various electric light sources. Incandescent lamps have an R:FR ratio of 0.7, which is what plants would perceive when they are adjacent to neighboring plants but not directly shaded.
High-pressure sodium (HPS) lamps, on the other hand, have an R:FR ratio of about 4.8, metal halide lamps have R:FR ratios varying from 2.6 to 3.4. and white light LEDs (regardless of color temperature) have R:FR ratios varying from 3.6 to 4.0. Various fluorescent lamps have R:FR ratios varying from 5.5 to 13.0 and above.
The common reason for these high R:FR ratios is that, putting aside technology limitations, the lamps are designed for visual applications – there is no reason for them to generate invisible far-red radiation. If they did, it would simply lower their luminous efficacy (lumens per electrical watt) values.
With only blue and red LEDs, the R:FR ratio is essentially infinite. SAS responses can sometimes be elicited by blue light alone, but the likelihood is that many plants will not recognize the presence of neighboring competitors when irradiated by most grow lights.
Far-Red Applications
This leaves open many questions regarding the possible applications of far-red LEDs. While various species and cultivars may grow well (or not) under the familiar blue and red (“blurple”) LEDs, they may not exhibit any shade avoidance syndrome responses. In some situations, these responses may actually be desirable. For instances, sun-loving plants that are grown in shade may be more compact, but they may also exhibit greater pathogen and drought resistance, and they may generate desirable secondary metabolites as defense mechanisms. Their flowering may be advanced or delayed, the number of buds may change … the list goes on.
It is also possible that end-of-day far-red pulses of radiation at low irradiance levels may have a greater effect on plant growth than during the day, as this is when gene expression is particularly active. (Blue light pulses at dawn have also been shown to change plant morphology.) One advantage is that this requires less energy than having the far-red LEDs continuously on during the day.
For horticulturalists and floriculturists, experimentation with far-red LEDs offers opportunities for developing species- and cultivar-specific light recipes as trade secrets. If horticultural luminaire manufacturers have not yet said why far-red LEDs are useful, it is because there is much that still needs to be researched and discovered. With a basic knowledge of the science behind far-red radiation and the phytochromes, it becomes practical to experiment with light recipes and photoperiods, and to understand why the plants respond the way they do.
Ian Ashdown, P. Eng., FIES, Senior Scientist, SunTracker Technologies Ltd.
Published: 18/07/13
There is a common-sense argument being presented in the popular media that since humans evolved under sunlight, our bodies must surely make use of all the solar energy available to us. Given that more than 50 percent of this energy is due to near-infrared radiation, we are clearly risking our health and well-being by using LED lighting that emits no near-infrared radiation whatsoever.
Fact or Fiction?
To examine this issue, we begin with a few definitions. There are several schemes used to partition the infrared spectrum. ISO 20473, for example, defines near-infrared radiation as electromagnetic radiation with wavelengths ranging from 780 nm to 3.0 mm (ISO 2007). Meanwhile, the CIE divides this into IR-A (780 nm to 1.4 mm) and IR-B (1.4 mm to 3.0 m), while noting that the borders of near-infrared “necessarily vary with the application (e.g., including meteorology, photochemistry, optical design, thermal physics, etc.)” (CIE 2016).
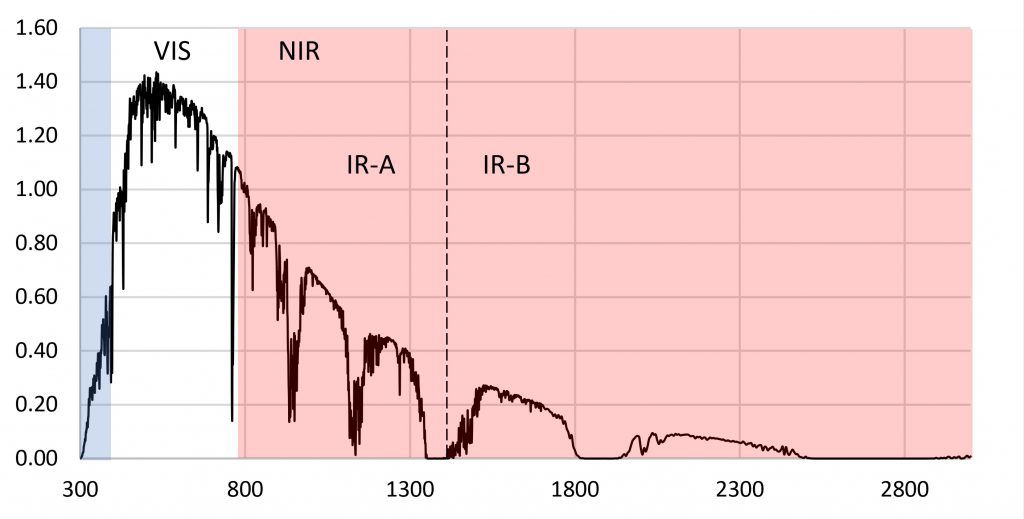
The terrestrial solar spectrum that we are exposed to on a clear day is shown in Figure 1. This varies somewhat depending on the solar elevation, which is in turn dependent on the latitude, time of day, and date. However, Figure 1 is sufficient for discussion purposes.
Figure 1 – Terrestrial solar spectrum. (ASTM G173-03).
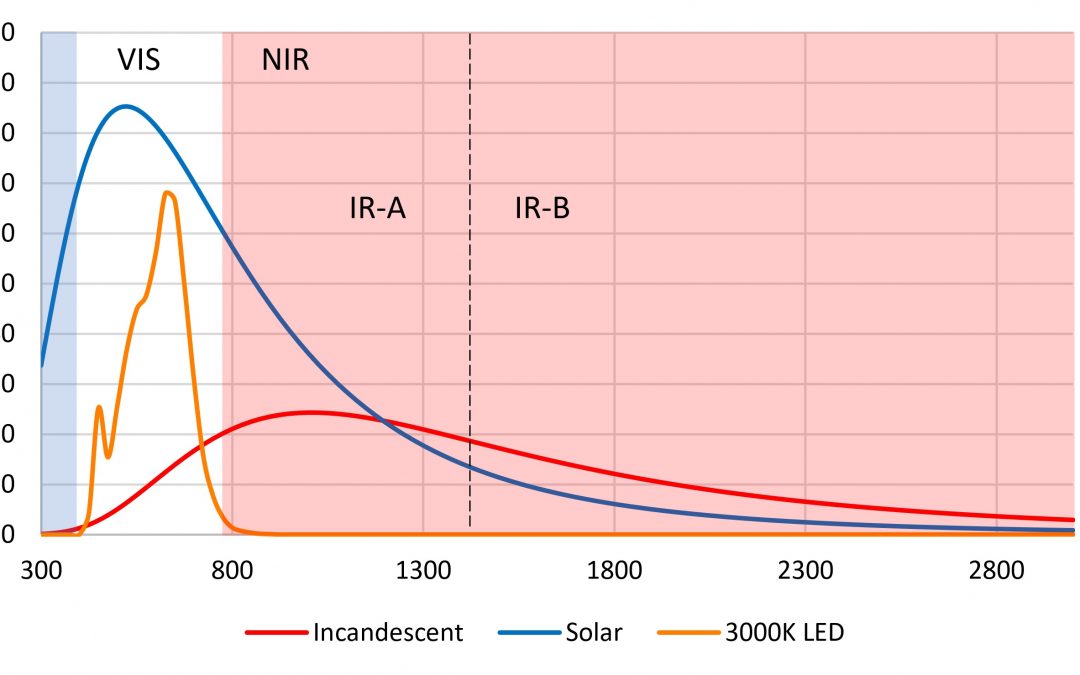
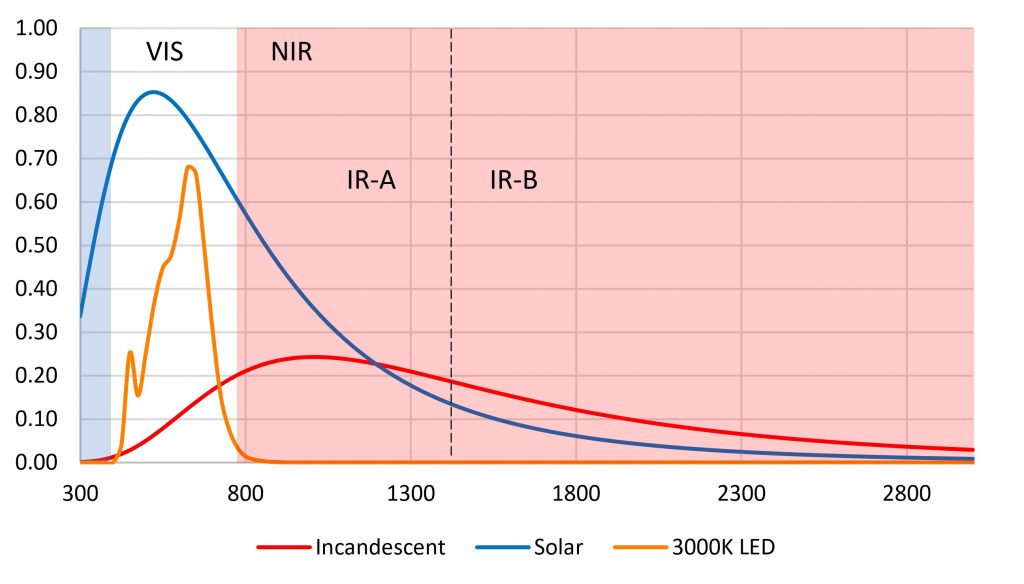
Compared to sunlight, modern-day electric lighting, and in particular LED lighting, is sorely deficient in near-infrared radiation. Figure 2 illustrates the problem, where the terrestrial solar spectrum has been approximated by a blackbody radiator with a color temperature of 5500 K. Look at the spectrum of incandescent lights – they clearly provide the near-infrared radiation that we need. By comparison, 3000-K LEDs (and indeed, any white light LEDs) provide no near-infrared radiation whatsoever.
Figure 2 – Spectrum comparisons.
The same is true, of course, for fluorescent
lamps. Given how much time most people spend indoors, we have been depriving
ourselves of near-infrared radiation since the introduction of fluorescent
lamps in the 1950s!
This is only common sense, but it was also common sense that led Werner von Siemens to proclaim, “Electric light will never take the place of gas!” Common sense notwithstanding, the above two paragraphs are patent nonsense.
A Sense of Scale
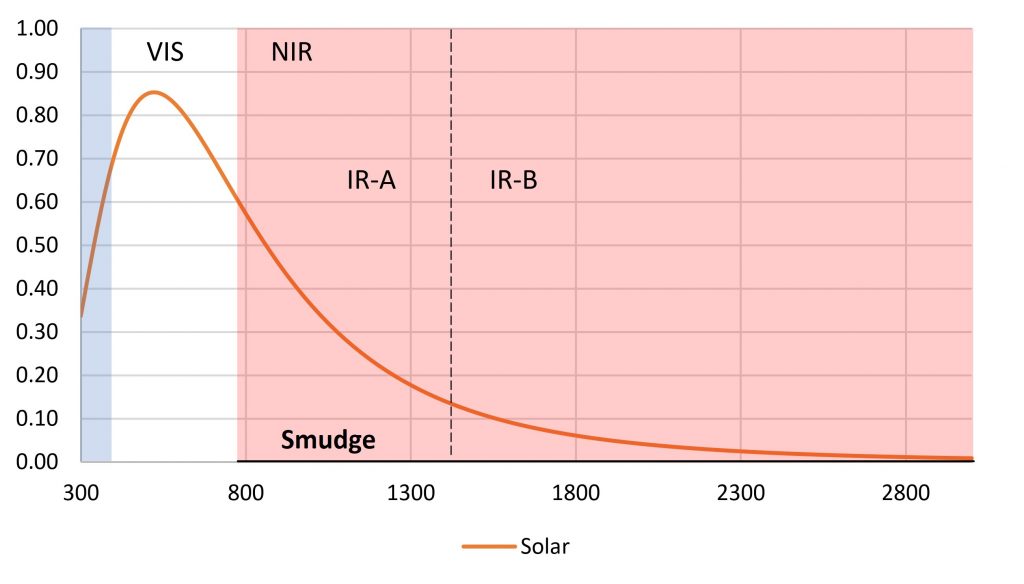
Figure 2 is deliberately misleading, even though it was recently published in a trade journal elsewhere without comment. The problem is one of scale. If we go back to the early 1950s with its predominantly incandescent lighting in homes and offices, illuminance levels were on the order of 50 to 200 lux. Meanwhile, outdoor illuminance levels are on the order of 1000 lux for overcast days, and 10,000 to 100,000 lux for clear days.
Even on an overcast day, we would have received roughly five to ten times as much near-infrared radiation outdoors as we would have indoors. On a clear day, it would have been five hundred to one thousand times. Given this, properly scaled incandescent and 3000-K LED plots in Figure 2 would both be no more than smudges on the abscissa.
Figure 3 – Infrared “smudge” (see text for explanation).
Common sense should also tell us that we have survived quite nicely without near-infrared radiation in our daily lives ever since we began spending our time in offices and factories rather than working in the fields during the day. It does not matter whether the electric light sources are incandescent, fluorescent, or LED – the amount of near-infrared radiation they produce compared to solar radiation is inconsequential.
This does not mean, however, that near-infrared radiation has no effect on our bodies. There are hundreds, if not thousands, of medical studies that indicate otherwise. For lighting professionals, it is therefore important to understand these effects and how they relate to lighting design.
Low Level Light Therapy
Many of the medical studies involving near-infrared radiation concern low level light therapy (LLLT), also known as “low level laser therapy,” “cold laser therapy,” “laser biostimulation,” and most generally, “photobiomodulation.” Using devices with lasers or LEDs that emit visible light or near-infrared radiation, these therapies promise to reduce pain, inflammation, and edema; promote healing of wounds, deeper tissues, and nerves; and prevent tissue damage.
Laser therapy is often referred to as a form of “alternative medicine,” mostly because it is often difficult to quantify its beneficial effects in medical studies. Unfortunately, the popular literature, including magazine articles, personal blogs, product testimonials, and self-help medical websites, often reference these studies as evidence that near-infrared radiation is essential to our health and well-being. In doing so, they overlook two key points: irradiance and dosage.
Irradiance
The adjective “low level” is somewhat of a misnomer, as it is used to distinguish LLLT medical devices from high-power medical lasers used for tissue ablation, cutting, and cauterization. The radiation level (that is, irradiance) is less than that needed to heat the tissue, which is about 100 mW/cm2. By comparison, the average solar IR-A irradiance is around 20 mW/cm2 during the day, with a peak irradiance reaching 40 mW/cm2 (Piazena and Kelleher 2010).
This is not a fair comparison, however. In designing studies to test LLLT hypotheses, there are many parameters that must be considered, including whether to use coherent (laser) or incoherent (LED) radiation, the laser wavelength (or peak wavelength for LEDs), whether to use continuous or pulsed radiation, and the irradiance, target area, and pulse shape. Tsai and Hamblin (2017) correctly noted that if any of these parameters are changed, it may not be possible to compare otherwise similar studies.
Solar near-infrared radiation has its own complexities. In Figure 1, the valleys in the spectral distribution are mostly due to atmospheric absorption by water and carbon dioxide. Further, the spectral distribution itself varies over the course of the day, with relatively more of the visible light being absorbed near sunrise and sunset. Simply saying “solar near-infrared” is not enough when comparing daylight exposure to LLLT study results.
Complicating matters even further is the fact that near-infrared radiation can penetrate from a few millimeters to a centimeter or so through the epidermis and into the dermis, where it is both absorbed and scattered. The radiation is strongly absorbed by water at wavelengths longer than 1150 nm, so there is an “optical window” between approximately 600 nm and 1200 nm where low level light therapy devices operate.
The biochemical details of how near-infrared radiation interacts with the human body are fascinating, with the primary chromophores hemoglobin and melanin absorbing the photons and then undergoing radiationless de-excitation, fluorescence, and other photochemical processes. For our purposes, however, these details are well beyond the focus of this article.
What is of interest, however, is that whatever positive results may be attributed to a given medical study, because of the differences elucidated above it is difficult to compare them with exposure to solar near-infrared radiation. Further, the irradiance levels are considerably higher than what we would experience outdoors on a clear day, and much higher than we would experience indoors, even with incandescent light sources. Given this, it is generally inappropriate to consider LLLT studies as evidence that near-infrared radiation is essential to our health and well-being.
Dosage
The Bunsen-Roscoe law, also known as the “law of reciprocity,” is one of the fundamental laws of photobiology and photochemistry. It states that the biological effect of electromagnetic radiation is dependent only on the radiant energy (stated in joules), and so is independent of the duration over which the exposure occurs. That is, one short pulse of high irradiance is equal one or more long pulses at low irradiance, as long as the energy (duration times irradiance) is the same.
Unfortunately, human tissue does not obey this law. Instead, it exhibits a “biphasic dose response,” where larger doses (i.e., greater irradiance) are often less effective than smaller doses. At higher levels (greater than approximately 100 mW/cm2), the radiant power induces skin hyperthermia (that is, overheating), while at lower levels, there is a threshold below which no beneficial effects are observed (Huang et al. 2009). This is presumably due to various repair mechanisms in response to photo-induced cellular damage.
This is not to say that solar near-infrared radiation may not have a beneficial effect. As an example, a study of wound healing in mice using 670-nm red LEDs demonstrated significant increases in wound closure rates beginning at 8 mW/cm2 irradiance (Lanzafame et al. 2007). This is comparable with an average 20 mW/cm2 solar IR-A irradiance on a clear day. However, this is also orders of magnitude greater than the average irradiance that might be expected indoors from incandescent light sources.
As an aside, it should be noted that treatment of dermatological conditions with sunlight, or heliotherapy, was practiced by ancient Egyptian and Indian healers more than 3,500 years ago (Hönigsmann 2013). However, this involved the entire solar spectrum from 300 nm (UV-B) to 2500 nm (IR-B); it is impossible to relate the effects of such treatments to near-infrared radiation alone.
Near-Infrared Radiation Risks
Based on the evidence of low level light therapy studies, there appears to be scant evidence – if any – that a lack of near-infrared radiation in indoor environments is deleterious to our health and well-being. If anything, the minimum required irradiances and the biphasic dose response argue against it.
There are, in fact, known risks to near-infrared radiation exposure. Erythema ab igne, for example, is a disorder characterized by a patchy discoloration of the skin and other clinical symptoms. It is caused by prolonged exposure to hearth fires, and it is an occupational hazard of glass blowers and bakers exposed to furnaces and hot ovens (e.g., Tsai and Hamblin 2017). It is not a risk to the general population, however, in that the irradiance is usually many times that of solar near-infrared irradiance.
More worryingly, IR-A radiation can penetrate deeply into the skin and cause tissue damage, resulting in photoaging of the skin (Schroeder et al. 2008, Robert et al. 2015), and at worst, possibly skin cancers (e.g., Schroeder et al. 2010, Tanaka 2012). Sunscreen lotions may block ultraviolet radiation that similarly causes photoaging and skin cancers, but they have no effect on near-infrared radiation.
Evolutionary Adaptation
Excess amounts of ultraviolet radiation can cause erythema (sunburn) in the short term, and photoaging and skin cancers in the long term. Curiously, pre-exposure to IR-A radiation preconditions the skin, making it less susceptible to UV-B radiation damage (Menezes et al. 1998). This is probably an evolutionary adaptation, as the atmosphere absorbs and scatters ultraviolet and blue light in the morning hours shortly after sunrise (Barolet et al. 2016). This morning exposure to IR-A radiation is likely taken as a cue to ready the skin for the coming mid-day exposure to more intense ultraviolet and near-infrared radiation. Late afternoon exposure to decreased amounts of ultraviolet radiation may further be taken as a cue to initiate cellular repair of the UV-damaged skin. In this sense then, solar near-infrared radiation is an identified benefit.
Conclusion
So, are we risking our health and well-being by using LED lighting that emits no near-infrared radiation, or is this patent nonsense as stated above? Perhaps surprisingly, the answer is that we do not know.
The above discussion has focused on the effects of near-infrared radiation on the skin and low level light therapy. Given that the irradiances and dosages of LLLT are much greater than those experienced from indoor lighting (including incandescent), it is inappropriate to cite LLLT medical studies in support of near-infrared lighting.
This does not mean, however, that there are not benefits to long-term exposure to near-infrared radiation, or risks from the lack thereof. The problem is in identifying these possible benefits and risks. Without obvious medical consequences, epidemiological studies would need to be designed that eliminate a long list of confounding factors, from light and radiation exposure to diet and circadian rhythms. They would also need to be performed with laboratory animals, as human volunteers are unlikely to agree to completely avoid exposure to daylight for months to years at a time.
In the meantime, we as lighting professionals must work with the best available knowledge. Lacking any credible evidence that very low levels of near-infrared radiation is necessary for our health and well-being, there appears to be no reason not to continue with LED and fluorescent light sources.
References
Barolet D et al. 2016. Infrared and skin: Friend or foe. J Photochem Photobio; B: Biology. 155:78-85.International Commission on Illumination [CIE]. 2016. International Lighting Vocabulary, 2nd ed. CIE DIS 017/E:2016. Vienna, Austria: CIE Central Bureau.
Hönigsmann H. 2013. History of phototherapy in dermatology. Photochem Photobio Sci. 12:16-21.
Huang AC-H et al. 2009. Biphasic dose response in low level light therapy. Dose-Response. 7(4):358-383.
International Organization for Standards [ISO]. 2007. ISO 20473:2007, Optics and Photonics – Spectral Bands. Geneva, Switzerland: ISO.
Lanzafame RJ et al. 2007. Reciprocity of exposure time and irradiance on energy density during photoradiation on wound healing in a murine pressure ulcer model. Lasers in Surg Med. 39(6):534-542.
Menezes S et al. 1998. Non-coherent near
infrared radiation protects normal human dermal fibroblasts from solar ultraviolet
toxicity. J Investig Derm. 111(4):629-633.
Piazena H, Kelleher DK. 2010. Effects of infrared-A irradiation on skin: Discrepancies in published data highlight the need for exact consideration of physical and photobiological laws and appropriate experimental settings. Photochem Photobio. 86(3):687-705.
Robert C et al. 2015. Low to moderate doses of infrared A irradiation impair extracellular matrix homeostasis of the skin and contribute to skin photodamage. Skin Pharm Physiol. 28:196-204.
Schroeder P et al. 2008. The role of near infrared radiation in photoaging of the skin. Exp Geron. 43(7):629-632.
Tanaka Y. 2012. Impact of near-infrared radiation in dermatology. World J Derm. 1(3):30-37.
Tsai S-R, Hamblin MR. 2017. Biological
effects and medical applications of infrared radiation. J Photochem Photobio;
B: Biology. 170:197-207.
Ian Ashdown, P. Eng. FIES, Senior Scientist, SunTracker Technologies Ltd.
Published: 18/09/03
Numerous medical
studies have shown that exposure to blue light at night suppresses the
production of melatonin by the pineal gland in our brains and so disrupts our
circadian rhythms. As a result, we may have difficulty sleeping. It is
therefore only common sense that we should specify warm white (3000 K) light
sources wherever possible, especially for street lighting.
True or false?
To answer this
question, we first need to define what we mean by “blue light.” Neither the
Illuminating Engineering Society (IES) nor the Commission Internationale
d’Eclairage (CIE) define the term in their online vocabularies. However, UL,
LLC (formerly Underwriters Laboratories Inc.) has recently introduced its UL Verified Mark , a “third-party product
claims verification program.” One such Verified Mark
is shown in Figure 1:
FIG. 1 – UL Verified Mark example.
The verification process for this mark is described thus:
“In accordance with LM-79-08, Section 9.1, measure the radiation emitted by the product across the visible spectrum of 380 – 780 nm. From the visible spectrum radiation measurement, determine the amount of ‘blue light’ radiation emitted between 440 – 490 nm. To calculate the percent of blue light emitted, divide the amount of blue light radiation by the amount of radiation measured across the complete visible spectrum.”
The lower wavelength limit of 440 nm seems somewhat arbitrary unless you also define “violet light,” but the upper wavelength limit of 490 nm makes sense; wavelengths in the region of 490 to 570 nm appear to be varying hues of green. This makes it easy – if we eliminate light of all wavelengths below 490 nm, we should not have any concerns about suppressing the production of melatonin and possible sleep disruption.
True or false?
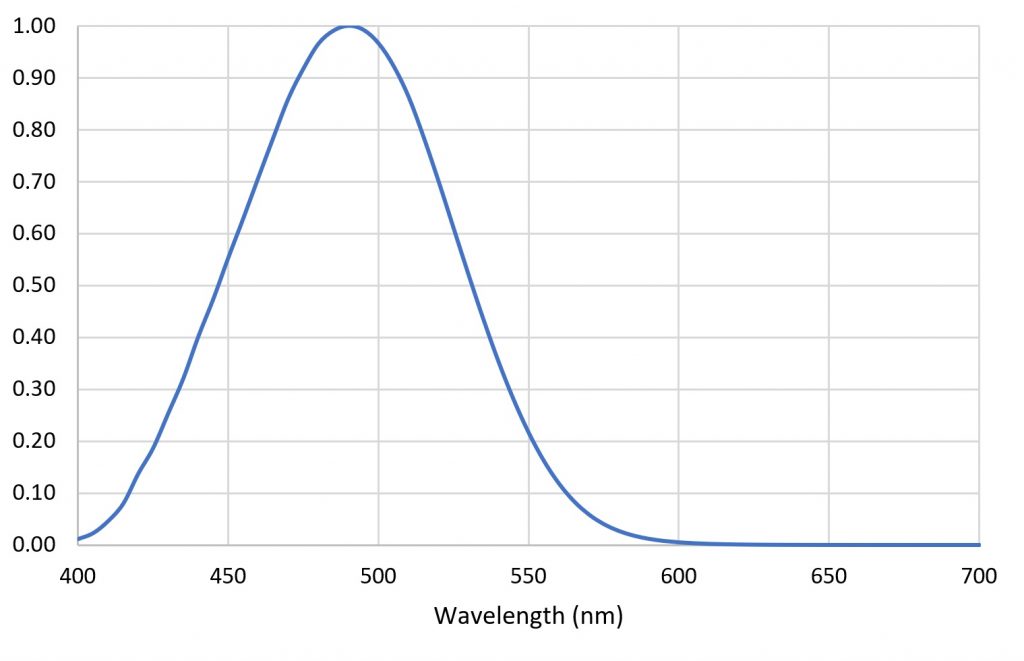
To answer this question, we need to take a closer look at those medical studies. The human retina has a smattering of intrinsically photosensitive retinal ganglion cells, or ipRGCs. Similar to the more familiar rods and cones, these ipRGCs contain a photosensitive protein called melanopsin. The sensitivity of melanopsin varies with wavelength, as shown in Figure 2.
It is these ipRGCs that sense “blue light” and send signals to the suprachiasmatic nucleus (SCN), a tiny region of some 20,000 neurons in the brain that is responsible for instructing the pineal gland when to produce melatonin.
Looking more closely at Figure 2, however, it is evident that the ipRGCs’ spectral sensitivity peaks at 490 nm, as well as extending to the ultraviolet edge of the visible spectrum at 380 nm. Most important, fully half the the spectral sensitivity of melanopsin is to green light.
Common sense is starting to look rather nervous …
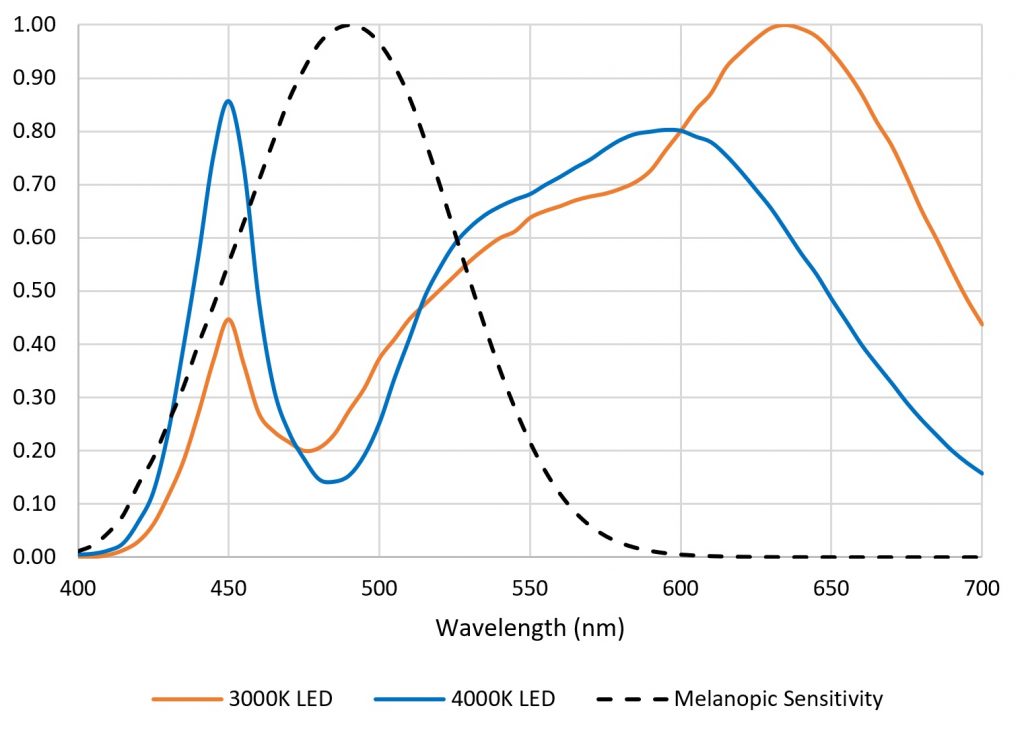
The spectral sensitivity shown in Figure 2 is interesting enough, but it becomes even more so when we consider what it means for how we respond to the radiation emitted by white light LEDs.
Figure 3 shows the relative spectral power distributions (SPDs) of typical white light LEDs with correlated color temperatures (CCTs) of 3000 K and 4000 K, scaled such that both LEDs produce equal amounts of luminous flux.
FIG. 3 – White light LED spectral power distributions.
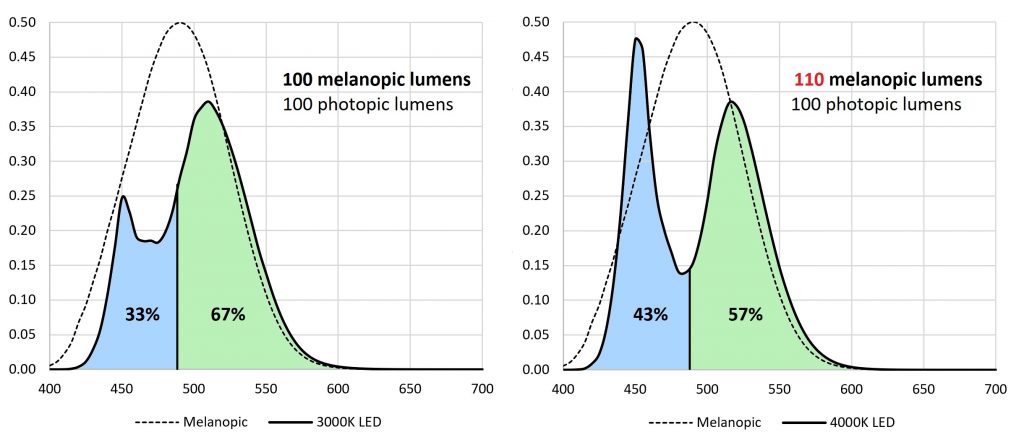
Determining the relative response of ipRGCs to these LEDS is easy – we simply multiply their SPDs by the melanopic sensitivity function on a per-wavelength basis, as shown in Figure 4.
FIG. 4 – Examples of LED melanopic lumens. Left: 3000 K; right: 4000 K.
Common sense, it would seem, has good reason to be nervous. Yes, 3000-K LEDs produce less melanopic flux than 4000-K LEDs when they produce equal luminous flux. However, the difference is only ten percent. This is within the tolerance of architectural and roadway lighting design practices. As such, it should not be argued that 3000-K LEDs are required for nighttime lighting in order to minimize circadian rhythm disruption – the difference in melanopic flux does not support this. Rather, it is simply one of several factors that must be considered when designing and specifying lighting systems.
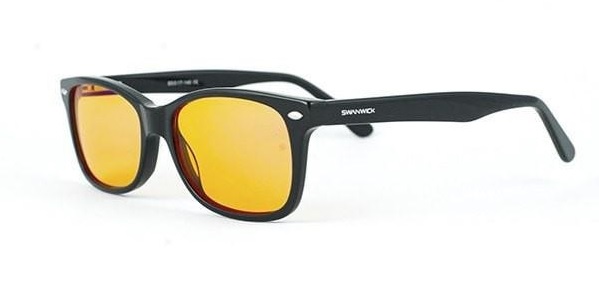
Blue-Blocking Glasses
Figure 4 highlights another issue: the efficacy of blue-blocking glasses, which are often marketed as promoting better sleep (Figure 5).
If we assume that the yellow filters provide a perfect cutoff at 490 nm, they are only 33% effective in blocking melanopic flux from 3000-K (warm white) LEDs and 43% effective with 4000-K (neutral white) LEDs. In reality, the filters likely let through some amount of blue light in the region of 470 nm to 490 nm, and so they may be even less effective.
Simply put, we cannot prevent melanopic flux emitted by white light sources from impacting our circadian rhythms unless we use deep-red filters. This is not to say that blue-blocking filters on eyeglasses or light sources do not work – they inarguably block blue light. However, melanopic flux includes both blue and green light.
From a marketing perspective, it is fair to say that blocking blue light may alleviate circadian rhythm disruption and loss-of-sleep issues, even if it is due to the placebo effect. (There are many other psychophysiological and environmental parameters involved in circadian rhythm entrainment that are not discussed here.) However, it is incorrect to claim that blocking blue light will eliminate melatonin suppression and so prevent circadian rhythm disruption. The facts state otherwise.
Electronic Devices
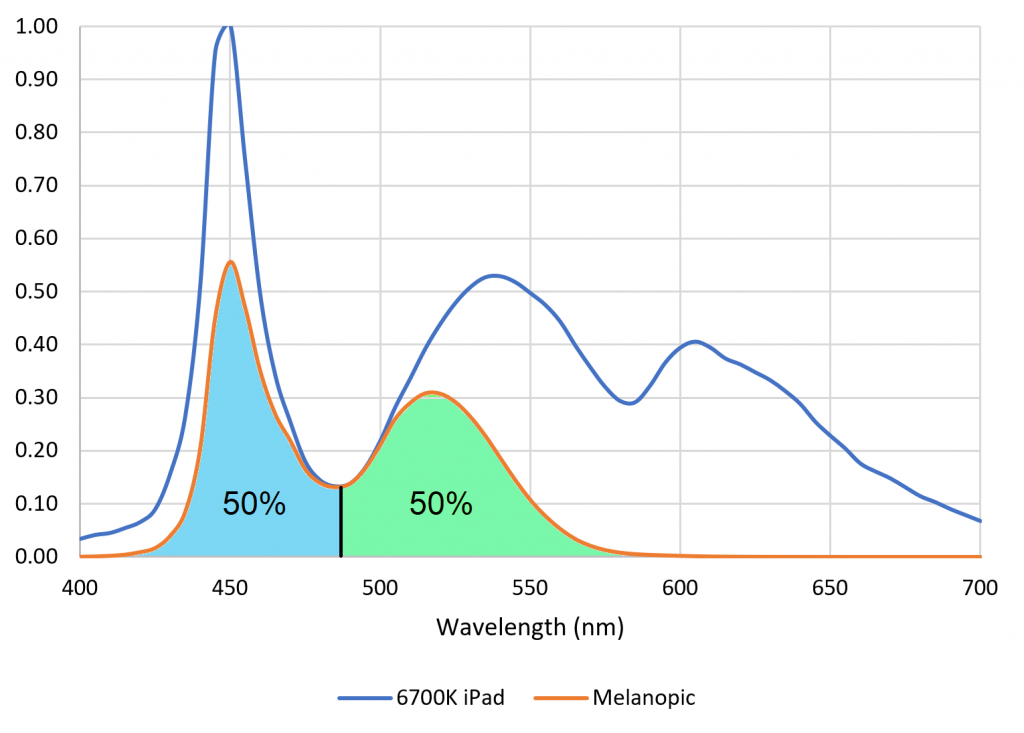
Finally, what about those evil electronic devices that threaten our sleep? Figure 6 shows the spectral power distribution of an Apple iPadÔ and the resultant melanopic flux when the display is set to full white (which has a CCT of 6700 K, somewhat higher than the 6500-K white point of most computer monitors).
FIG. 6 – Apple iPad melanopic flux.
As shown by Figure 6, the best any optical filter or software-based change in the device white point (that is, a change in color temperature) can hope to achieve is a 50 percent reduction in melanopic flux.
What is more important, however, is that iPad screen luminance is approximately 400 cd/m2 (nits). This is on the order of 50 to 100 times the light levels recommended for residential street lighting. If we are to complain about light trespass from residential street lighting into our bedrooms causing sleep deprivation, we cannot ignore the influence of the televisions, computer monitors, and tablets that we often stare at for hours before going to bed, and in much closer proximity.
Conclusions
Research into the influence of spectral content and retinal illuminance on circadian rhythms is ongoing (e.g., Nagare et al., 2015). As such, this article should not be taken as evidence (or lack thereof) for the effect of “blue light” on our sleep patterns. Rather, it is a reminder to look beyond the marketing claims of “blue-light blocking” products and ask what this really means.
To answer the question of whether we should specify warm white (3000 K) light sources for street lighting, the answer is, “it depends.” All things being equal, the difference in melanopic flux between 3000-K and 4000-K LEDs is only ten percent. This is within the uncertainty of light design practices, and so more weight should be given to residents’ concerns, aesthetics, color discrimination, and energy savings when making design and specification decisions.
To answer the question of whether eliminating light of all wavelengths below 490 nm (that is, “blue light”) will eliminate any concerns about melatonin suppression and possible sleep disruption, the answer is clear: FALSE!
References
CIE. 2015. Report on the First International Workshop on Circadian and Neurophysiological Photometry, 2013. CIE Technical Note TN 003:2015.
Nagare, R., et
al. 2017. “Does the iPad Night Shift Mode Reduce Melatonin Suppression?”
Lighting Research and Technology.
Ian Ashdown, P. Eng., FIES, Senior Scientist, SunTracker Technologies Ltd.
Published: 2014/07/26
Do you suffer from math anxiety? A surprising number of us do (e.g., Wigfield 1988). I would tell you the exact numbers, but you would need to understand statistical analysis …
Fortunately, we can mostly muddle through our lives without having to deal with statistics, vector calculus, differential geometry, algebraic topology and all that. As an electrical engineer in the 1980s for example, I never needed anything more than a four-function calculator to do my work designing billion-dollar transportation systems.
Our fear (note the implicit “we”) can, however, disadvantage us in subtle ways. In studiously ignoring the mathematics of a topic, we all too often overlook the underlying concepts that help us better understand what we are interested in.
An example from lighting design: luminous intensity. We measure the luminous intensity of a light source in candela, which is defined as “one lumen per steradian” (IES 2010). A lumen is easy enough to understand, but what the blazes is a “steradian”?
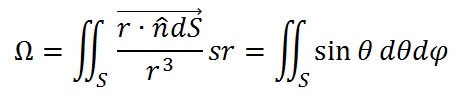
The all-knowing Wikipedia has an answer: it is the measure of a “solid angle.” Going to the Wikipedia definition of this phrase, we see:
Anxiety? What anxiety?
But now for a trade secret: most mathematicians do not think in terms of equations like these double integrals. Instead, they visualize. Just as lighting designers can look at architectural drawings and imagine lighting designs, mathematicians can look at a set of equations — which are really nothing more than an arcane written language — and visualize new mathematical concepts and proofs.
I learned this from a professor of mine whose specialty was hyperspace geometry — he could “easily imagine” four- and five-dimensional objects by mentally projecting them into three-dimensional shapes and imagining how their shadows changed as he rotated the objects in his mind. Some people …
So, we start by visualizing a circle (FIG. 1):
FIG. 1 – Circle with radius r.
If you remember anything at all from mathematics in school, it is that the circumference C of a circle with radius r is equal to two times pi times its radius, or:
C = 2 * pi * r
where pi is approximately 3.14159. (Remember that 1980s-era four-function calculator ñ it is all you will need for this.)
What this means is that if we take a piece of string with length r, we will need to stretch it by a factor of two pi (6.28328 …) to wrap around the circumference of the circle.
But suppose we wrap the string with length r part way around the circle (FIG. 2). The resultant angle is precisely one radian, which is abbreviated rad.
Most of us are used to thinking of angles in terms of degrees ñ there are 360 degrees in a circle. (The reason for the magic number 360 is lost in history, according to Wikipedia.) This means that one radian is equal to 360 / (2 * pi) = 180 / pi degrees, which is approximately 57.3 degrees. Radians are more useful simply because they are related to the geometry of the circle rather than some magic number — they are easier to visualize and so understand.
Now, imagine a sphere with radius r, and with a cone-shaped section whose base has a surface area of r * r, or r2 (FIG. 3):
FIG. 3 – Solid angle.
This cone has a solid angle of precisely one steradian (or one “solid radian”), which is abbreviated sr.
No mathematics required — easy.
(To be precise, a solid angle does not need to be a circular cone-shaped section as shown in FIG. 3. The top of the cone can be any shape; all that matters is the ratio of the surface area of the base to the radius r.)
How many “square degrees” in a steradian? That’s also easy: if one radian is equal to 180 / pi degrees, then one steradian is equal to (180 / pi) * (180 / pi), or approximately 3282.8, square degrees.
To be honest, I also suffer from math anxiety when first reading a set of equations. I do not really understand them until I can visualize what they mean. Mathematical equations are just the formal written language we use to express what we have visualized.
… now if only I could understand batting averages in baseball and cricket …
References
IES. 2010. IES Lighting Handbook, Tenth Edition. New York, NY: Illuminating Engineering Society of North America.
Wigfield, A., and J. L. Meece. “Math Anxiety in Elementary and Secondary School Students,” Journal of Educational Psychology 80(2):210-216.
Ian Ashdown, P. Eng., FIES, Senior Scientist, SunTracker Technologies Ltd.
Published: 2013/10/08
If you are involved with outdoor area or roadway lighting design, you will undoubtedly encounter such terms as mesopic multipliers, scotopic lumens, and S/P ratios, and you will sooner or later need to consider mesopic photometry in your design efforts. For example, you may encounter a government specification that states, “Luminaires must have a minimum S/P ratio of x.” What does this mean and, equally important, where can you find this information?
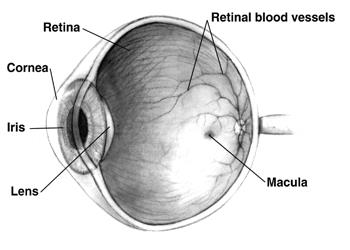
It begins with the human eye:
Fig. 1 – Human eye anatomy.
where light entering the eye through the cornea is focused on the retina. The retina consists of approximately six million cones located mostly at the center of the retina, surrounded by some 120 million rods. The cones, which are responsible for our color vision, function best in bright light, while the color-blind rods are responsible for our night vision.
For scenes with an average luminance above approximately 5.0 cd/m2, photopic vision dominates. The cones have an average spectral response that is described by the photopic luminous efficiency function V(λ) with peak responsivity at 555 nm (Fig. 2). Below approximately 0.005 cd/m2, scotopic vision dominates, with the rods having a spectral response that is described by the scotopic luminous efficiency function V'(λ) with peak responsivity at 507 nm (Fig. 2).
Fig. 2 – Luminous efficiency functions.
Mesopic vision occurs when the average scene luminance is between approximately 0.005 and 5.0 cd/m2, as both the rods and cones contribute to what we perceive.
We can directly perceive this blending of photopic and scotopic vision due to the Purkinje effect. Cones are more sensitive to red light than are rods. As the light levels dim, red colors appear to darken more quickly than other colors:
Fig. 3 – Purkinje effect.
This is due to the gradual shift from the photopic to the scotopic luminous efficiency function as the rods begin to predominate.
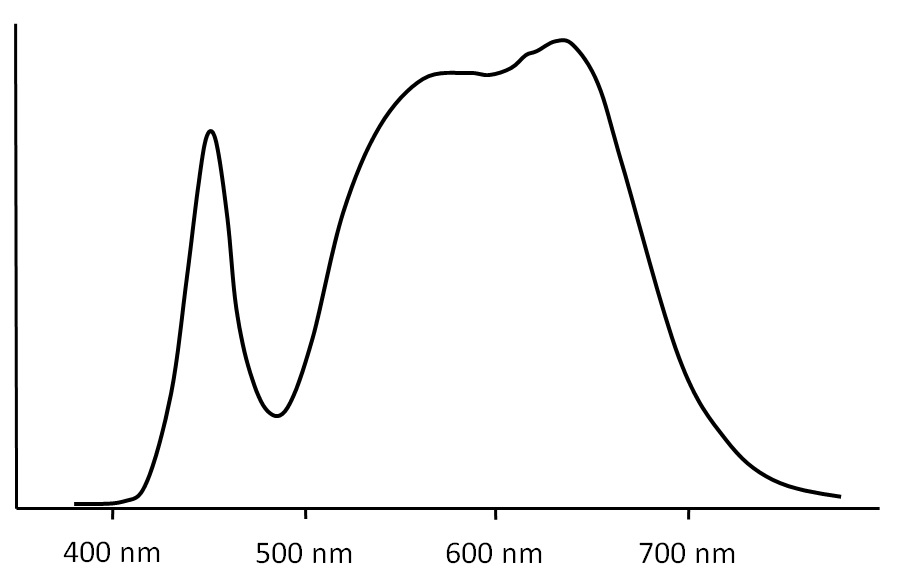
A light source will have a characteristic spectral power distribution (SPD), such as this one for a typical cool white fluorescent lamp:
Fig. 4 – Cool white fluorescent lamp spectral power distribution.
Calculating the photopic lumens generated by a light source is easy: multiply the SPD by the photopic luminous efficiency function on a per-wavelength basis (typically at 5 nm intervals), sum the results, and scale as required. Calculating the scotopic lumens is the same, only using the scotopic luminous efficiency function.
Herein lies the crucial point: because the photopic and scotopic luminous efficiency functions are different, they will yield different values for the scotopic and photopic lumens. The ratio of these two values is the scotopic-to-photopic (S/P) ratio. In general, light sources with more blue light will have higher S/P ratios. For example:
Lamp Type
Typical S/P Ratio
Low-pressure sodium
0.2
High-pressure sodium
0.4 to 0.6
Halogen headlamp
1.4
Linear fluorescent
1.3 to 2.3
Metal halide
1.2 to 2.1
Warm white LED
1.2
Cool white LED
2.0
Table 1 – Typical S/P ratios
More detailed tables are available (e.g., IES TM-12-12), but the question has to be asked: will the S/P ratio change when the luminaires are relamped?
Some publications on mesopic lighting have indicated that the S/P ratio of a lamp can be estimated from its correlated color temperature (CCT), but this is incorrect except for incandescent lamps (which have little practical application to mesopic lighting). Here for example are two LED modules with the same CCT of 3500 K but very different spectral power distributions and different S/P ratios.
Fig. 5A – Phosphor-coated 3500 K LED (SP = 1.41).Fig. 5B – Red-green-blue 3500 K LED module (S/P = 2.02)
Simply put, the only way to accurately determine the S/P ratio of a light source is through calculation using its spectral power distribution.
Scotopic lumens are important because they better represent how bright objects appear under low light level conditions than do photopic lumens. This leads to the concept of effective luminance factors (ELF). These factors are defined simply as:
ELF = mesopic luminance / photopic luminance
Comprehensive ELF tables are presented in IES TM-12-12 and CIE 191:2010, but they can be summarized as:
S/P
0.01
0.03
0.10
0.30
1.00
3.00
0.25
0.25
0.48
0.70
0.82
0.91
0.97
0.50
0.50
0.69
0.81
0.88
0.94
0.98
0.75
0.78
0.85
0.91
0.94
0.97
0.99
1.00
1.00
1.00
1.00
1.00
1.00
1.00
1.25
1.18
1.12
1.08
1.05
1.02
1.00
1.50
1.35
1.17
1.16
1.10
1.05
1.01
1.75
1.50
1.35
1.23
1.15
1.07
1.02
2.00
1.65
1.46
1.30
1.19
1.10
1.02
2.25
1.79
1.56
1.37
1.24
1.12
1.03
2.50
1.93
1.66
1.44
1.28
1.14
1.04
Table 2 – Effective Luminance Factors (cd/m2)
Table 4.2 of the IES Lighting Handbook somewhat confusingly presents mesopic multipliers, which are intended “to adjust recommended photopic illuminance target values for mesopic adaptation.” They are the inverse of effective luminance factors.
Some caution is needed here in that a government or industry specification may have already taken mesopic lighting into account, in which case the specified minimum luminance has already had a mesopic multiplier applied. This will undoubtedly be the case if the specification also includes a minimum S/P ratio for the light sources. When in doubt, ask.
But now the fun begins — a specification is much more likely to specify a minimum photopic illuminance value, expressed in lumens per square meter (or foot). Now what?
To begin with, mesopic photometry (for lighting applications) assumes that all surfaces being illuminated are: a) grey or pastel-colored; and b) diffuse reflectors. In this case, the luminance L of the illuminated object is given by:
L = ρ * E / π
where ρ is the reflectance of the surface and E is the illuminance. (As a reminder, π is approximately 3.14.)
If the surface is strongly colored, then the spectral power distribution of the reflected light will be very different from the SPD of the light source, and so the S/P ratio will not apply in terms of the surface luminance.
This assumes of course that the surface reflectance is known or can be estimated. For example, the diffuse reflectance of roadway surfaces ranges from approximately 8 percent for bituminous asphalt to 17 percent for concrete (Gillet 2001). Ideally, the target reflectance will be included in the specification.
We must now ask, “What is the meaning of average scene luminance?” The point here is that mesopic photometry depends on the visual adaptation of the viewer to the average scene luminance. Unlike other photometric quantities such as lumens, luminance, luminous intensity, luminous exitance, and illuminance, mesopic quantities are meaningless without a viewer whose state of visual adaptation is known.
As it turns out, the majority of the cones in the retina occupy only the central 2 degrees or so of our visual field of view (called the fovea). It may seem nonsensical, but we perceive color only within a region about the diameter of two thumbnails held at armís length. We may think we perceive color within our entire field of view, but this is only because our brains are filling in the details as we visually scan a scene.
What this means is that our mesopic adaptation is mostly determined by the luminance of the surface we happen to be looking at (Moon 1943). The background surround has very little influence on this adaptation (less than 10 percent). As we shift our gaze towards different objects, our visual adaptation state changes accordingly.
Visual adaptation is not, of course, instantaneous. It is a complex mechanism involving mechanical changes in pupil size, photochemical changes (pigment bleaching in the retina), and neural changes (synaptic interactions). This is likely why the IES Lighting Handbook (Section 4.12.3, “Spectral Effects”) recommends that mesopic photometry not be applied to roadway lighting where the speed limit is greater than 40 kph (25 mph). (This limit may be increased in the future, subject to ongoing roadway vision research.)
In view of the above, IES TM-12-12 defines the mesopic adaptation field as the point on a surface that the viewer is looking at, and then recommends the following calculation procedure:
Determine the effective luminance multiplier ELF based on S/P and Lphotopic.
Convert the photopic luminance to the effective (mesopic) luminance Leffective = Lphotopic * ELF
Reiterate steps 5 to 8 while modifying the design until Leffective equals or exceeds Ldesign.
If necessary, calculate the effective target illuminance Eeffective = Leffective * π / ρ.
Given this, you would expect that roadway and outdoor area luminaire manufacturers would provide S/P ratios for their products, but to date this has not been the case. Information on lamp S/P ratios can be exceedingly difficult to find. Possible reasons include:
The S/P ratio is a function of the lamp or lamp module rather than the luminaire. For fluorescent and high-pressure discharge (HID) lamps, the luminaire manufacturer typically has no control over what lamps the contractor or owner may install in the luminaires.
Most lamp manufacturers do not provide SPDs or S/P ratios for their products. This is difficult to explain, as they can be easily measured by a spectroradiometer by an independent photometric laboratory.
The SPDs of fluorescent and HID lamps is a function of their proprietary gas fill mixtures and phosphors. If lamp manufacturers were to provide S/P ratios for their products, they might have to change their product numbers if these proprietary formulations were to change.
The SPDs of white light LEDs are dependent on the dominant wavelength of the blue pump LEDs and the proprietary phosphors and phosphor mixtures used to down-convert the blue light to longer wavelengths. Again, if LED manufacturers were to provide S/P ratios for their products, they might have to change their product numbers if these proprietary designs were to change. (For whatever reason, phosphor manufacturers are equally protective of the detailed SPDs for their products.)
Many LED lamp module manufacturers purchase their LEDs from third parties, and so have no control over changes to the LEDs apart from specifying minimum luminous flux output and CCT binning.
Many luminaire manufacturers purchase their LED modules from third parties, which makes it even more difficult for them to guarantee the S/P ratios of their products.
In an ideal world, lighting designers would have unfettered access to the S/P ratios of the luminaires they specify in order to perform mesopic lighting calculations. Unfortunately, this will require changes to the entire supply chain of phosphors, fluorescent and HID lamps, LEDs and LED modules, and luminaires. These changes are possible, but it may take some time for the lighting industry to adapt to the brave new world of mesopic photometry.
References
CIE. 2010. Recommended System for Mesopic Photometry Based on Visual Performance. CIE Technical Report 191:2010. Vienna, Austria: Commission International de l’Eclairage.
Gillet, M., and P. Rombauts. 2001. “Precise Evaluation of Upward Flux from Outdoor Lighting Installations (Applied in the Case of Roadway Lighting),” Proc. International Conference on Light Pollution. Serena, Chile.
IES. 2010. IES Lighting Handbook, Tenth Edition. New York, NY: Illuminating Engineering Society of North America.
IES 2012. Spectral Effects of Lighting on Visual Performance at Mesopic Lighting Levels. IES TM-12-12. New York, NY: Illuminating Engineering Society of North America.
Moon, P., and D. E. Spencer. 1943. “The Specification of Foveal Adaptation,” J. Optical Society of America 33(8):444-456.
This website uses cookies (mostly chocolate chip) to improve your experience. We'll assume you're ok with this, but you can opt-out if you wish. Cookie settingsACCEPT
Cookies Policy
Privacy Overview
This website uses cookies to improve your experience while you navigate through the website. Out of these cookies, the cookies that are categorized as necessary are stored on your browser as they are essential for the working of basic functionalities of the website. We also use third-party cookies that help us analyze and understand how you use this website. These cookies will be stored in your browser only with your consent. You also have the option to opt-out of these cookies. But opting out of some of these cookies may have an effect on your browsing experience.
Necessary cookies are absolutely essential for the website to function properly. This category only includes cookies that ensures basic functionalities and security features of the website. These cookies do not store any personal information.
Any cookies that may not be particularly necessary for the website to function and is used specifically to collect user personal data via analytics, ads, other embedded contents are termed as non-necessary cookies. It is mandatory to procure user consent prior to running these cookies on your website.